Learning Center
On this page
Learning Center
The Learning Center provides interactive courses to help you explore and work with eazyBI at your own pace. It offers structured lessons on various topics, featuring practical examples and hands-on activities to deepen your understanding. All courses are open to everyone, free of charge.
Jira Cloud
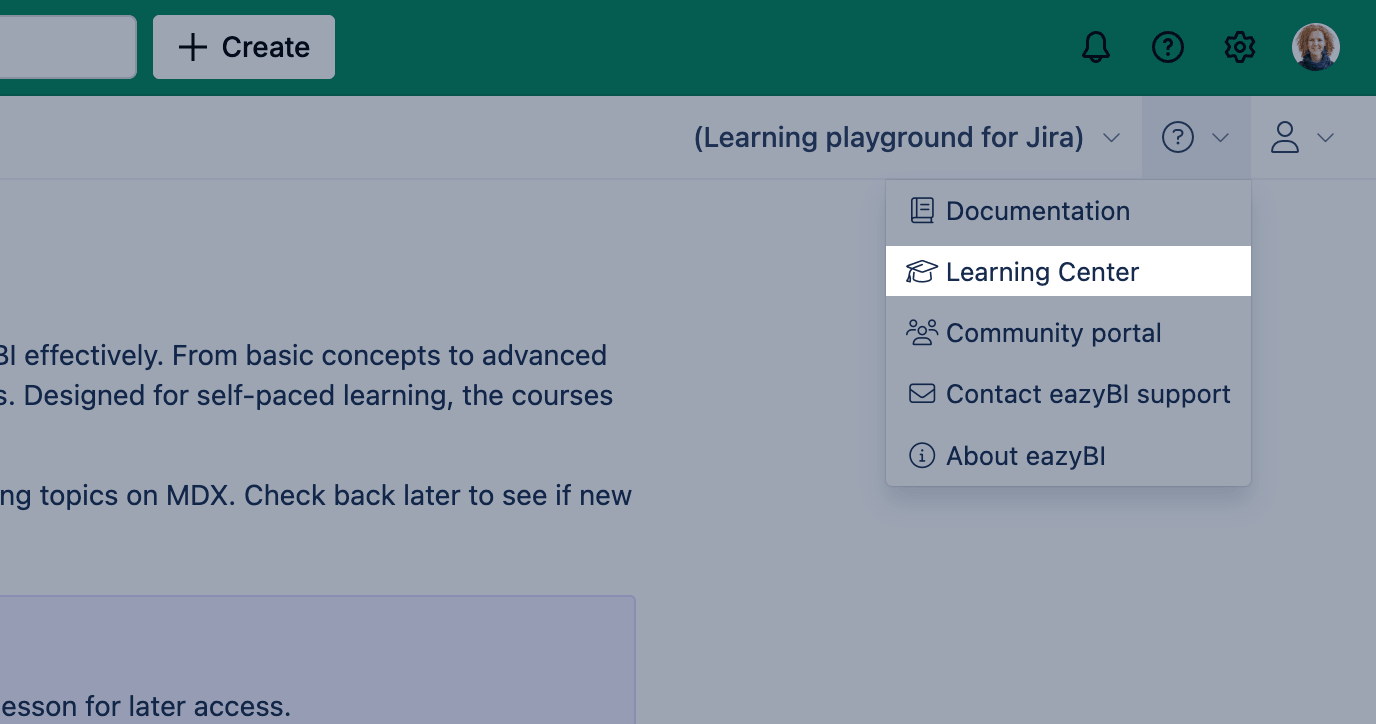
You can access the Learning Center from the eazyBI Help menu
Jira Data Center and other users
If you are not using eazyBI for Jira Cloud, you can sign up at eazybi.com/learning_center to access the Learning Center.
Learning Account and Courses
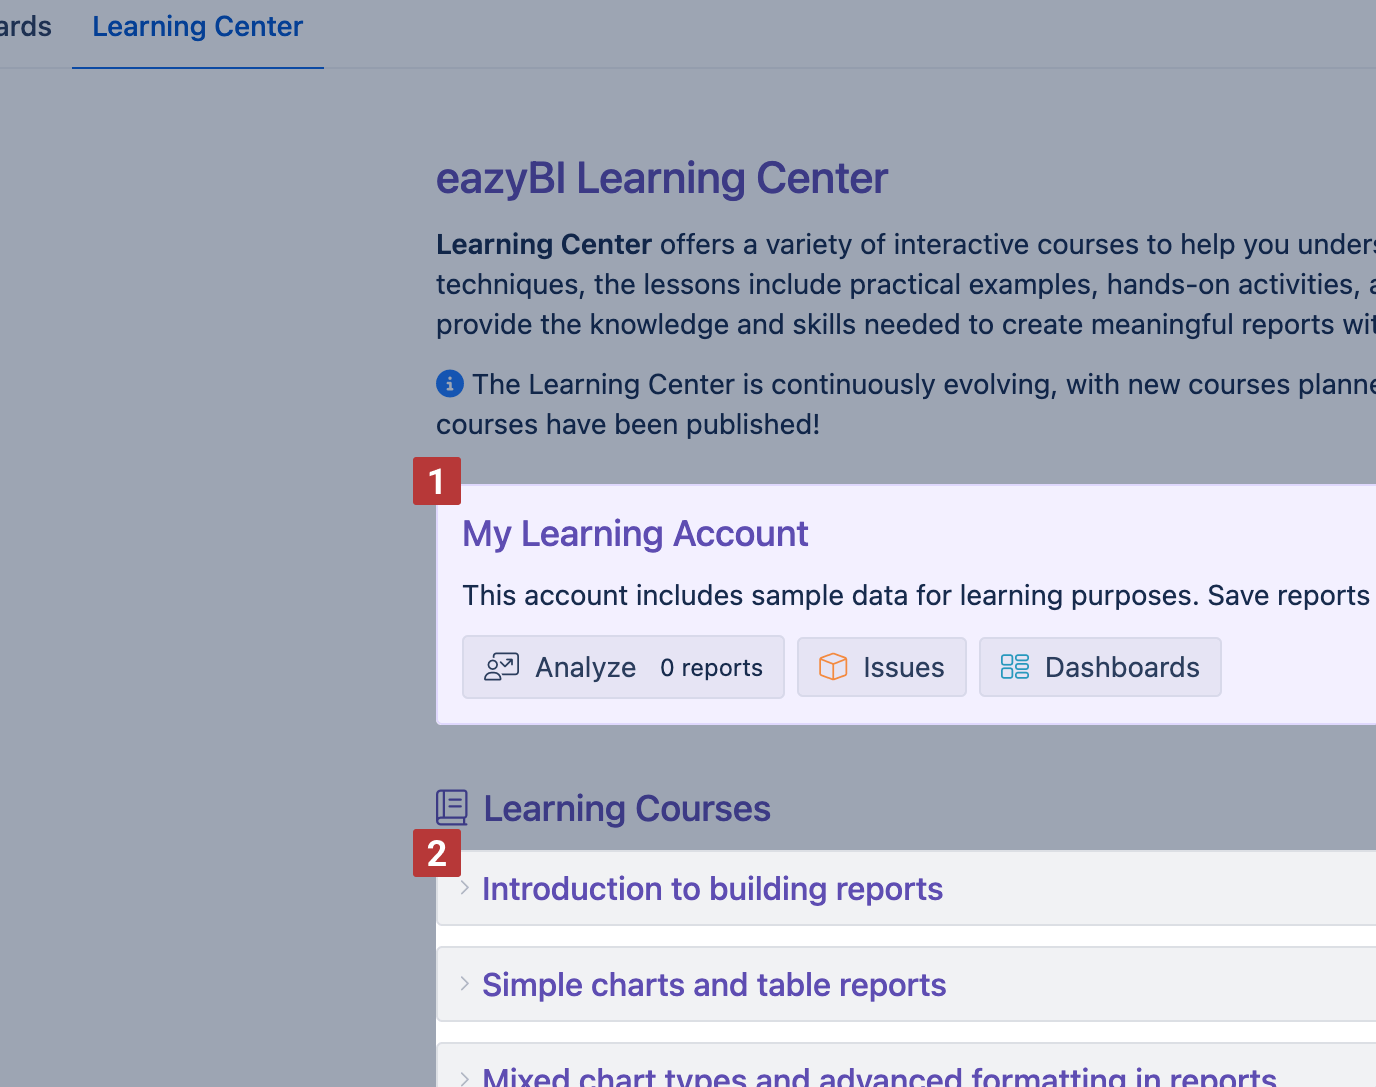
To start learning, create a learning account from the Learning Center home page. Any eazyBI user can create and set up their learning account with one click, without specific user rights.
This account:
- Includes preloaded Jira sample data (unrelated to your Jira data) designed specifically for training [1]
- Provides access to learning courses with guided lessons and exercises [2]
Once your learning account is set up, you can explore the available courses.
Lessons
Explore the learning lessons, which guide you through practical examples, helping you learn new concepts and see how to apply them in different scenarios. After each learning lesson, you can save the report you have created and access it in the learning account mentioned above.
Course content
Courses cover report building basics through to advanced MDX data analysis, with hands-on lessons and practical examples. They build in complexity, so beginners are encouraged to start from the beginning, but each course can be taken independently.
- Introduction to building reports
Learn the fundamentals of the eazyBI report builder – dimensions, measures, and filters. Practice creating your first reports, exploring data, and applying basic filtering and drill-through. - Simple charts and table reports
Build commonly used reports such as project overviews and progress tracking. Learn how to combine measures and dimensions, apply filters, and visualize data using different chart types. - Mixed chart types and advanced formatting in reports
Create more advanced visualizations by combining multiple chart types and axes. Apply conditional formatting to highlight the most important values and patterns. - Introduction to MDX calculated measures
Start working with calculated measures. Learn how to use standard calculations, write basic MDX formulas, and understand how calculations behave in reports. - Working with tuples in MDX
Learn how to control calculation context using tuples. Build calculations by combining members from different dimensions. - Calculated members in other dimensions
Extend calculations beyond measures by creating calculated members in dimensions. Use them for grouping, filtering, and customizing how data is displayed. - NEW Understanding sets in MDX
Work with sets to define groups of data for calculations. Use set functions to filter, aggregate, and analyze data.
See more
- Dashboard with Learning Center lesson reports