Custom chart example - Angular gauge chart
Private eazyBI
eazyBI for Jira
eazyBI already includes a gauge chart based on solid gauge chart from the Highcharts library. This is just an example of how to add a different gauge chart based on the angular gauge chart.
On this page:
Create custom JavaScript files
At first, create the public/javascripts directory in your Private eazyBI directory eazybi_private where custom JavaScript files will be stored.
Then create the public/javascripts/custom_gauge_chart.js file with the following implementation of Angular Gauge chart type:
Eazy.resultsViews.push({
  name: "Angular Gauge",
  key: "custom_angular_gauge",
  view: "CustomAngularGaugeChartView",
  icon: 'fa fa-dashboard'
});
CustomAngularGaugeChartView = Eazy.ChartView.extend({
  titleTemplate: _.template('' +
    '<span style="font-weight:bold" class="chart_member" data-fullname="<%= full_name %>" data-name="<%- name %>" ' +
    'data-position="<%- cid %>"><%- caption %></span>'),
  subtitleTemplate: _.template('<span style="font-weight:bold"><%= caption %></span>'),
  renderChart: function() {
    if (this.series.length != 5) {
      this.$el.html("Please use 5 columns - actual value and 4 range values.");
      return this;
    }
    var categoriesCount = this.categories.length,
        divWidth = categoriesCount <= 4 ? 100 / categoriesCount : 25;
    this.$el.empty();
    for (var ci = 0; ci < categoriesCount; ci++) {
      var category = this.categories[ci],
        serie = {
          name: this.series[0].name,
          data: [ this.series[0].data[ci] ]
        },
        minY, maxY,
        greenFromY, greenToY, yellowFromY, yellowToY, redFromY, redToY;
        minY = this.series[1].data[ci].y,
        greenY = this.series[2].data[ci].y,
        yellowY = this.series[3].data[ci].y,
        maxY = this.series[4].data[ci].y;
      if (this.series[1].data[ci].y < this.series[4].data[ci].y) {
        minY = greenFromY = this.series[1].data[ci].y;
        greenToY = yellowFromY = this.series[2].data[ci].y;
        yellowToY = redFromY = this.series[3].data[ci].y;
        redToY = maxY = this.series[4].data[ci].y;
      } else {
        minY = redFromY = this.series[4].data[ci].y;
        redToY = yellowFromY = this.series[3].data[ci].y;
        yellowToY = greenFromY = this.series[2].data[ci].y;
        greenToY = maxY = this.series[1].data[ci].y;
      }
      var $div = $("<div><div/>")
        .css({
          display: "inline-block",
          width: "" + divWidth + "%",
          height: "300px",
          overflowX: "hidden",
          marginBottom: "10px"
        }).appendTo(this.el);
      this.charts.push(new Highcharts.Chart(_.extend({}, this.chartOptions(), {
        chart: {
          renderTo: $div[0],
          type: 'gauge',
          plotBackgroundColor: null,
          plotBackgroundImage: null,
          plotBorderWidth: 0,
          plotShadow: false
        },
        title: {
          text: this.chartTitle(this.categories[ci]),
          y: 15
        },
        subtitle: {
          text: this.chartSubtitle(this.series[0]),
          y: 30
        },
        // the value axis
        yAxis: {
          min: minY,
          max: maxY,
          minorTickInterval: 'auto',
          minorTickWidth: 1,
          minorTickLength: 10,
          minorTickPosition: 'inside',
          minorTickColor: '#666',
          tickPixelInterval: 30,
          tickWidth: 2,
          tickPosition: 'inside',
          tickLength: 10,
          tickColor: '#666',
          labels: {
            step: 2,
            rotation: 'auto'
          },
          plotBands: [{
            from: greenFromY,
            to: greenToY,
            color: '#89A54E' // green
          }, {
            from: yellowFromY,
            to: yellowToY,
            color: '#DBC63D' // yellow
          }, {
            from: redFromY,
            to: redToY,
            color: '#AA4643' // red
          }]
        },
        series: [ serie ]
      })));
    }
  },
  chartTitle: function(category) {
    var self = this;
    return _.map(category, function(member){
      return self.titleTemplate({
        full_name: member.get("full_name"),
        name: member.get("name"),
        cid: member.cid,
        caption: member.get("caption")
      });
    }).join(" ");
  },
  chartSubtitle: function(serie){
    var self = this;
    return _.map(serie.name, function(member){
      return self.subtitleTemplate({
        caption: member.get("caption")
      });
    }).join(" ");
  },
  chartOptions: function() {
    var self = this;
    return({
      plotOptions: {
        gauge: {
          dataLabels: {
            formatter: function() {
              return this.point.name.formattedValue;
            }
          }
        }
      },
      pane: {
        startAngle: -150,
        endAngle: 150,
        background: [{
          backgroundColor: {
            linearGradient: { x1: 0, y1: 0, x2: 0, y2: 1 },
            stops: [
              [0, '#FFF'],
              [1, '#333']
            ]
          },
          borderWidth: 0,
          outerRadius: '109%'
        }, {
          backgroundColor: {
            linearGradient: { x1: 0, y1: 0, x2: 0, y2: 1 },
            stops: [
              [0, '#333'],
              [1, '#FFF']
            ]
          },
          borderWidth: 1,
          outerRadius: '107%'
        }, {
          // default background
        }, {
          backgroundColor: '#DDD',
          borderWidth: 0,
          outerRadius: '105%',
          innerRadius: '103%'
        }]
      },
      tooltip: {
        formatter: function() {
          var result = "";
          var category = self.categories[this.point.name.categoryIndex];
          result += "<b>" + Eazy.displayCaptions(category) + "</b><br/>";
          result += Eazy.displayCaptions(this.series.name) + ": ";
          result += this.point.name.formattedValue;
          return result;
        }
      }
    });
  },
  _detectUniqueCategoriesTitle: function() {
    // do not extract unique category in categoriesTitleMembers for this chart type
  }
});
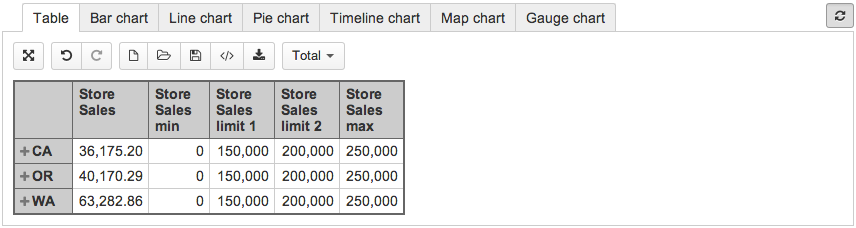
This chart assumes that you have selected five columns where the first one contains actual value and the next 4 are values for range limits in one of the following order:
- min value, max limit for green, max limit for yellow, max value (max limit for red) – use this is smaller values are green and larger are red
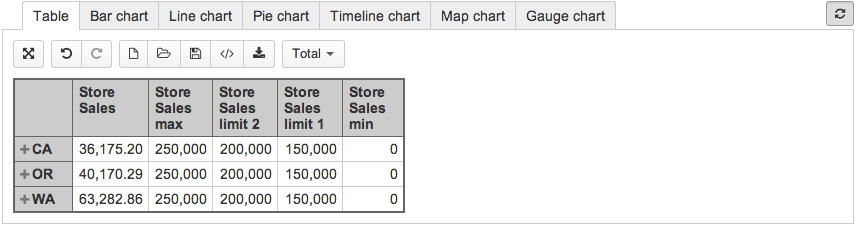
- max value, min limit for green, min limit for yellow, min value (min limit for red) – use this is larger values are green and smaller are red
Please see the Highcharts angular gauge chart documentation to get more information about available options for customizing chart appearance as well as see other examples.
Please see Custom chart for Private eazyBI example - Google Maps to learn more about adding a custom chart type to Eazy.resultsViews.
Include custom assets
Now create the app/views/layouts/_custom_head.html.haml file and include custom JavaScript files that you need for your custom charts:
- if include_custom_report_assets?
  = custom_javascript_include 'custom_gauge_chart'
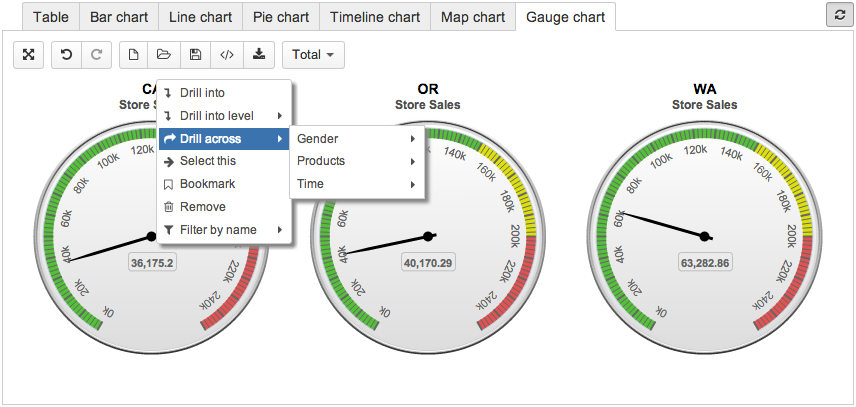
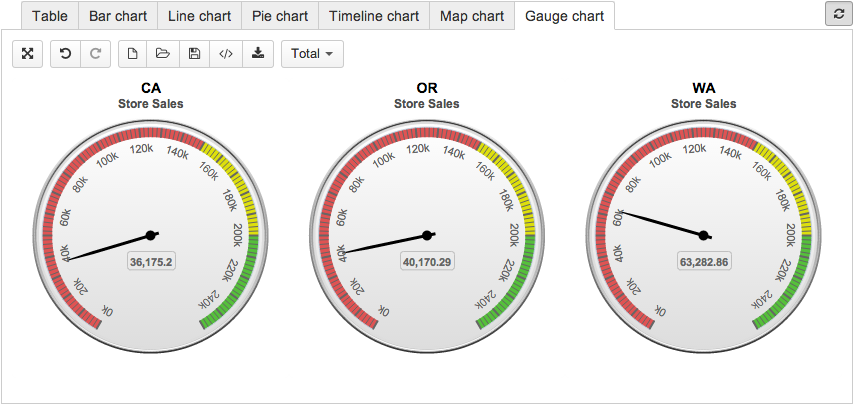
Example of chart usage