Child process
eazyBI for Jira
eazyBI for Confluence
By default, eazyBI is running inside the same Jira JVM process or Confluence JVM process and is sharing JVM heap memory and other resources with Jira or Confluence) and all other apps.
On this page:
Overview
eazyBI report queries are executed using the embedded Mondrian OLAP reporting engine. When you perform complex queries that need to access all issue data, then the Mondrian OLAP engine can use all available Java heap memory for the report results cache. It can occur when drilling through detailed issues, when calculating measures for all issues, or when cross-joining multiple dimensions in the report. If the Mondrian OLAP engine utilizes all available JVM process heap memory, then it might significantly slow down the overall Jira (or Confluence) performance.
Therefore, the eazyBI app launches a separate child JVM process, and report execution queries are proxied to this child process. CPU and memory expensive Mondrian OLAP engine operations are performed just in this child process and do not impact the main Jira JVM process heap memory usage (eazyBI for Jira) or Confluence JVM process heap memory usage (eazyBI for Confluence).
Settings
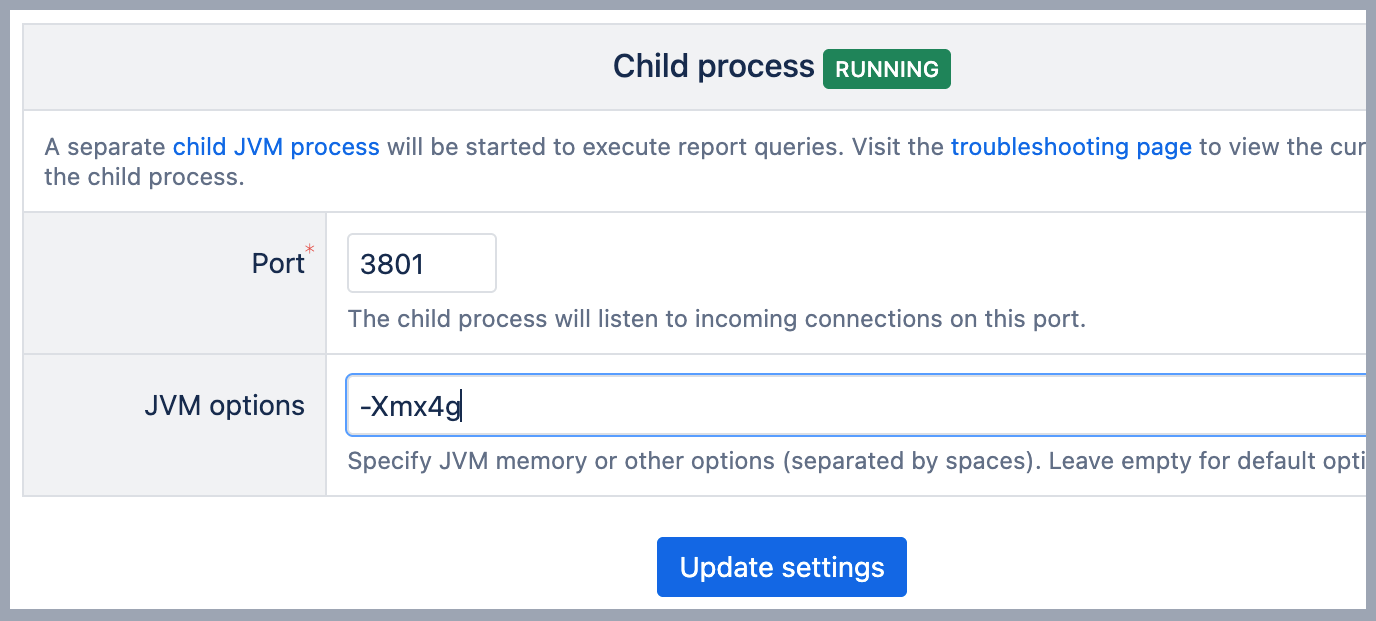
You can specify the following options for childprocess:
- Port
The child process will listen on this TCP/IP port for requests from the eazyBI plugin. By default, port number 3801 is suggested. If you run several Jira instances with the eazyBI plugin on the same server, then specify a different port number in each instance. - JVM options
Additional JVM options that you want to use for the child JVM process. By default, the following options are used:-Xms2g(initial JVM heap size 2GB). However, we recommend using at least 4GB:-Xmx4g(set max JVM heap size to 4GB) for a production environment. Many out of memory errors in logs might indicate insufficient memory.Please ensure that the server where Jira is running has enough free memory for the additional child process. If the operating system will not be able to provide the required memory for the child process, then it will cause memory swapping of disks and slow performance of the server.
If your database connection requires a custom SSL certificate, you may need to add
-Djavax.net.ssl.trustStoreand-Djavax.net.ssl.trustStorePasswordto the Child process JVM options.
The child process settings are stored in the Jira home directory in theeazybi.tomlfile (where database connection parameters are stored as well). In this file automatically generatedclient_secretsettings are stored as well – it is used for signing the authorization tokens when making the requests from eazyBI to the child process.After updating the child process settings, the child JVM process will be automatically started or stopped. If you visit the settings page again, then you will see the status of the child process – Running or Not running. If it is not running, then please check the
eazybi-child.outlog file (see below).
Log files
The child process will create and use the following log files in the Jira home directory log subdirectory:
eazybi-child.log– if the child process is successfully started, then report requests that are proxied to this process are logged in this log file (which previously were logged in the maineazybi-web.logfile).eazybi-child.out– the initial child process startup messages are logged in this file. If the child process was not started, then, most probably, you will see the error in this file. Send this file to eazyBI support if you need help to understand the cause of the error.eazybi-child.pid– in this file, the child process PID (process number) is stored.
Troubleshooting
There is a separate Child process section in the system administration Troubleshooting page (which is shown if the child process is enabled). In this section, you can see:
- The current status of the child process.
- Port on which the child process listens for requests from the eazyBI plugin.
- JVM heap memory statistics for the child process
- Total memory: The
java.lang.Runtime.getRuntime().totalMemory()is used to get this value. This is the memory currently available for the JVM for dynamic allocation (heap memory). This isn't the maximum amount of memory the app can use; however, if the app needs more memory, and if there's unallocated memory left within your JVM's maximum memory limit (which can be set during startup by-Xmxparameter), the total memory can grow. - Free memory: The
java.lang.Runtime.getRuntime().freeMemory()is used to get this value. This is the portion of memory that is currently unused in the JVM heap. It's not the total free memory available in your physical system but rather the space that can be immediately allocated for new objects without reallocating more memory from the system. - Max memory: The
java.lang.Runtime.getRuntime().maxMemory()is used to get this value. ThemaxMemory()method returns the maximum amount of heap space that can ultimately be used for memory management. This maximum limit is set by the-Xmxparameter when starting the JVM. The heap is created when the JVM starts, and its size can dynamically expand or contract (up to certain limits) based on the application's needs and the garbage collector's activities.
- Total memory: The
- JVM process CPU usage (not available on Windows).
- Uptime.
If necessary (e.g. if the child process consumes too much CPU or if the process is stuck), you can restart the child process from here. If you want to change the child process options (e.g. JVM max memory option or the port number) then go to the system administration Settings page.
In the Log files section, you can also view the last 1000 lines of eazybi-child.log or eazybi-child.out files.
Training videos
Overview of eazyBI infrastructure and configuration options. Built-in monitoring features and good-to-know things for running eazyBI. Some advice for configuration
Keeping things in order is helpful in all organizations but critical for large ones. Structure your eazyBI household, giving freedom to your teams and overview for management, and spend less time maintaining. Daina will show how to scale your eazyBI using account management, customized settings, options to organize data, and much more.

