Add standard calculations
When you have selected some numerical measure for a report, you can select Add calculated to add standard calculations based on the chosen measure and visible data in the report.
eazyBI adds a new column with a calcualted value to the report, which works just in this report. If needed, you can change the formatting for the calculated column by clicking on the column header and choosing Edit calculated.
Available calculations:

Statistical
Statistical calculations return the Average, Median, Min, Max value of all values on report rows. These calculations are based on all visible rows in the report; therefore, avoid expanding report rows as it dynamically recalculates results.

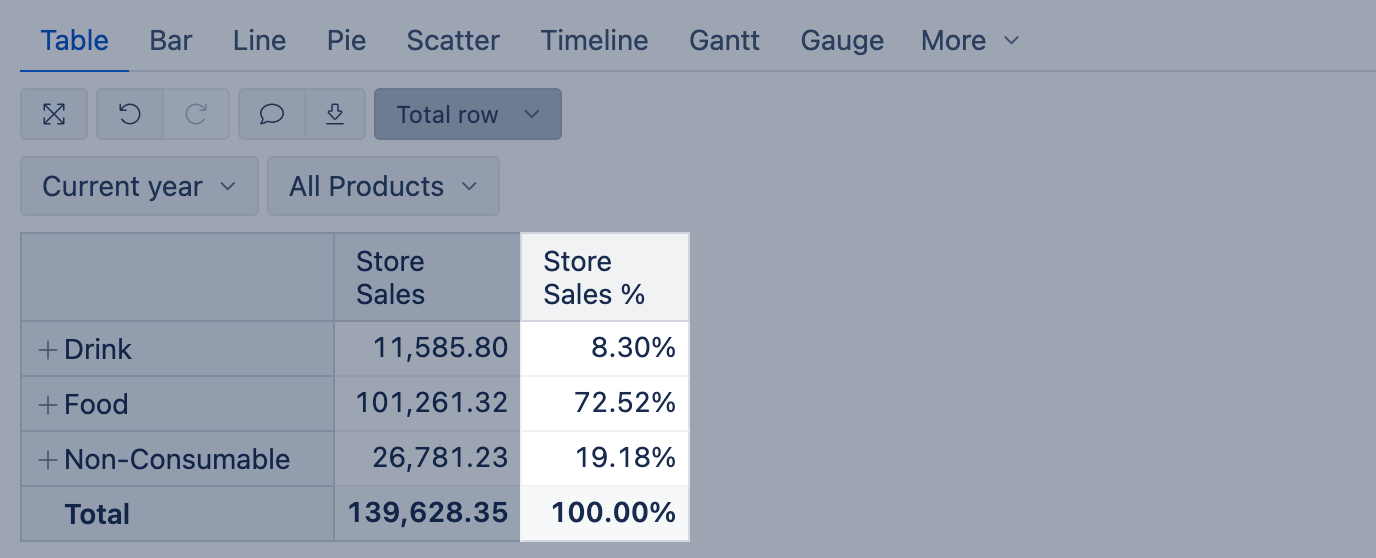
% of total
Calculate a % of total value from the sum of all visible rows; therefore, avoid expanding report rows as it dynamically recalculates results.
The sum of percentages is always 100%.
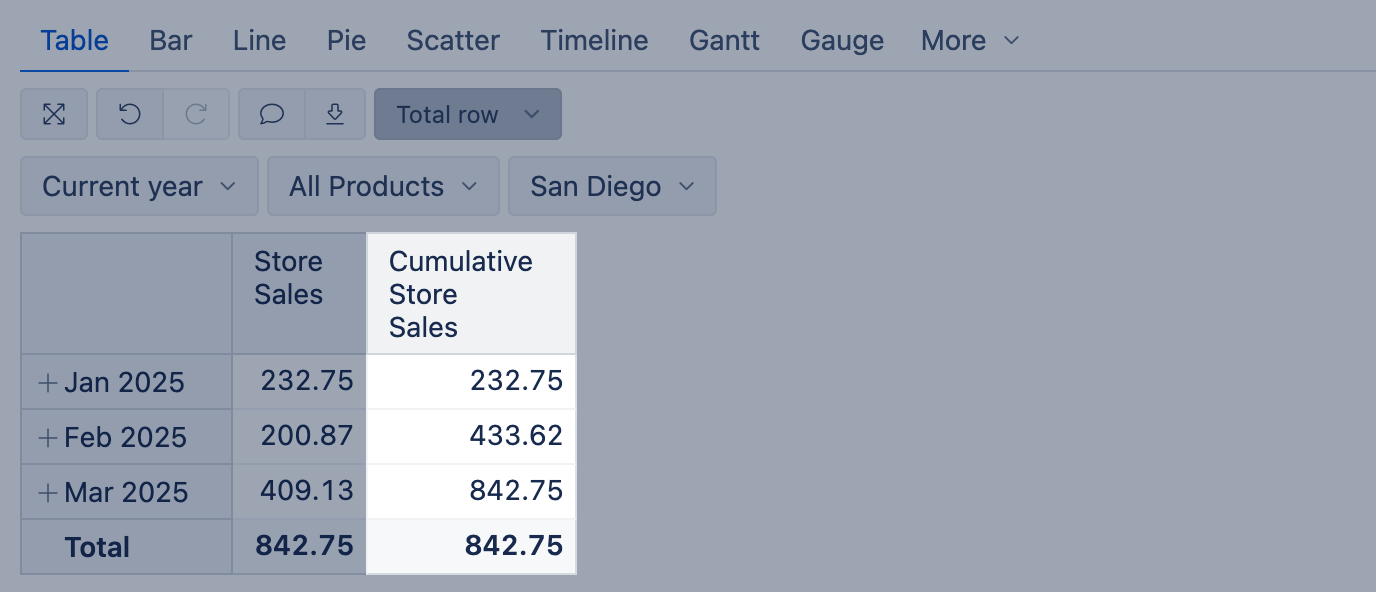
Cumulative sum
The cumulative sum can add values with or without empty values in any row for base measure. These calculations are based on all visible rows in the report; therefore, avoid expanding report rows as it dynamically recalculates results.
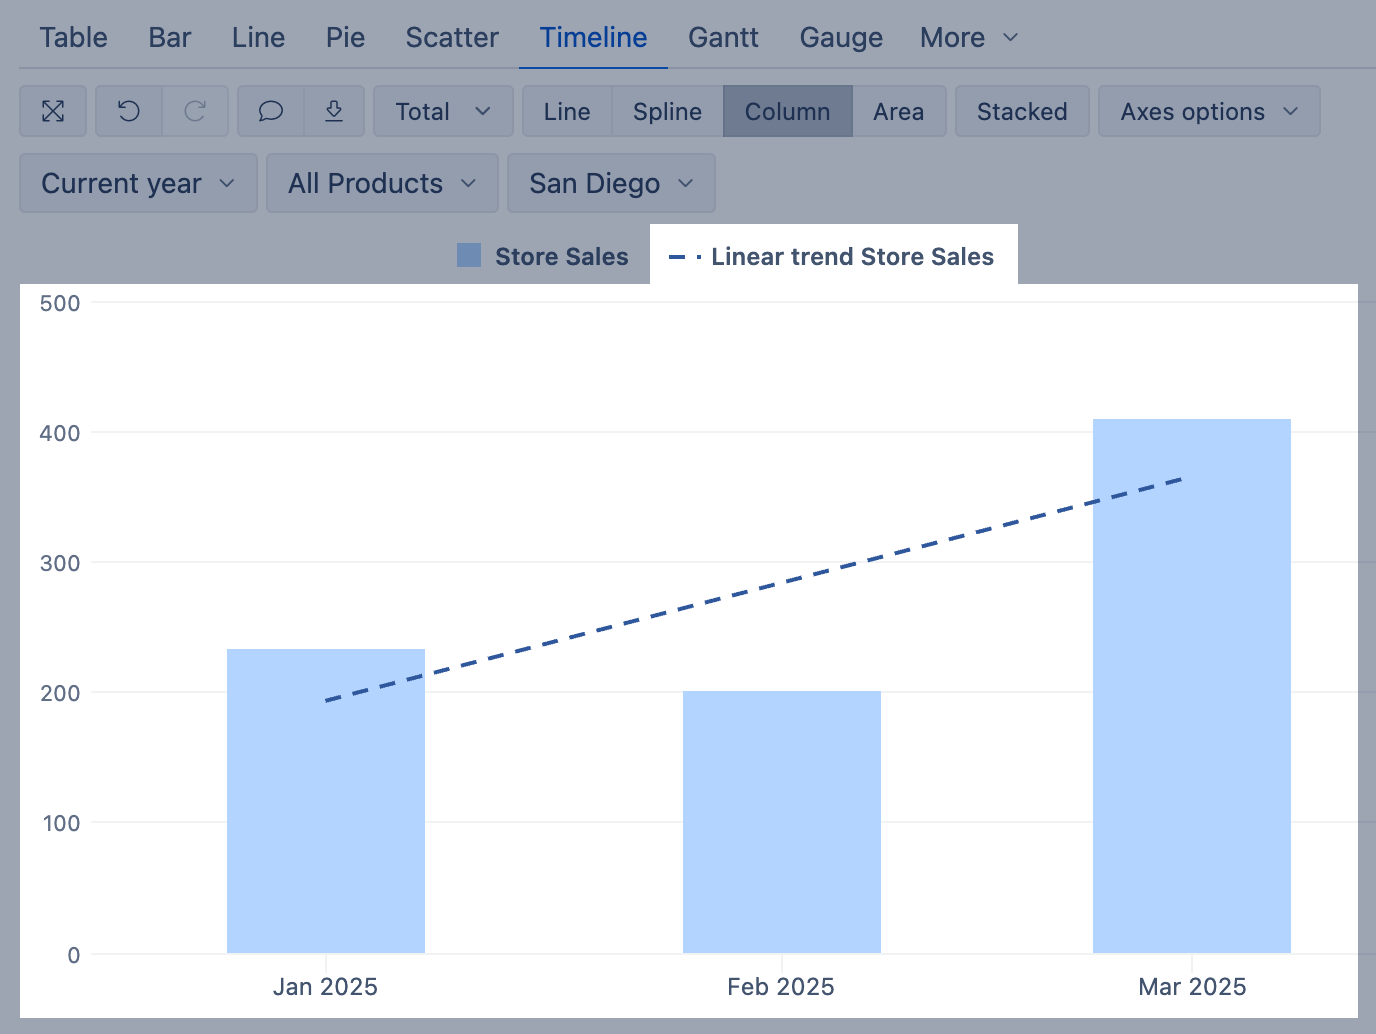
Linear trend
The linear trend generates a straight line representing the trend for this measure on visible rows; therefore, avoid expanding report rows as it dynamically recalculates results.
Time ago
Time ago calculations work with the Time dimension on Rows on a particular level (Month, Week, Day); therefore, avoid expanding report rows as it dynamically recalculates results. You can get the absolute value of the compared period, or calculate the change value, or the change %.
You can analyze Time on Rows compared to:
- Previous Period: eazyBI detects the level of a particular member and calculates results on that level. For example, it will get data from the previous week if selected for weeks.
- Month ago: eazyBI gets the value of a month ago period, suited just for Day and Month levels.
- Year ago: eazyBI gets the value of a similar period year ago.

Select a single period when using Time dimension only as page filter.
When using calculated members from the Time dimension (current month, last week etc.), always select default levels (year, quarter, month, week, day) in rows.
Sparklines
Sparklines make the table more informative by visualizing compared values with bars or giving a quick overview of the measure changes over time. The bars option shows the visual representation of value compared to the largest value on report rows. The last 6 periods, last 12 periods, last 30 days options show values of previous periods from the selected period in the Time dimension or current date (if Time is not in reports).

Make sure to choose the Sparkline formatting that best represents your data. To change the color of the Sparkline, choose the text or background color in the cell formatting of the Sparkline column.
Empty as 0
Standard calculation Empty as 0 could be used for cases when no values are in the measure, and you would like to return zero instead.
![]()