Create reports
eazyBI.com
eazyBI for Confluence
eazyBI for Jira
Private eazyBI
If you have not read it yet, then please start with an overview of eazyBI concepts.
Here you will find the main steps on how to start analyzing your uploaded or imported data and create and save reports. Go to the Analyze tab and chose to create New report or edit existing report.
Main principles:
- Use at least one numeric measure in the report, to bind your data together from different perspectives (dimensions). The measure is the treasure!
- First, build a report in a Table view. Then you can switch to a different chart type.
- Start simple and build report complexity gradually.
On this page:
Start creating a new report
Go to the Analyze tab to create a new report. See which user roles can create and update reports.
- Click New report to start with a blank report.
- Open an existing report to use it as a template for your new report, and Save as a new report.
You can use Report Builder Assistant to create or adjust a report.
Drag dimensions to Rows and Columns
In the upper part of the report creation view, you'll see the Dimensions section. You can drag and drop dimensions from this section into the Rows or Columns sections.
For Jira and other data sources, the core dimensions will show up in the Dimensions section.
If you import Custom fields, Sprint fields, or fields from other integrations as dimensions, they will appear under the core dimensions in their own expandable sections: Custom fields, Software (for Sprint dimensions), DevOps, and others. Click the "show N dimensions" next to the subsection name to view the dimensions.
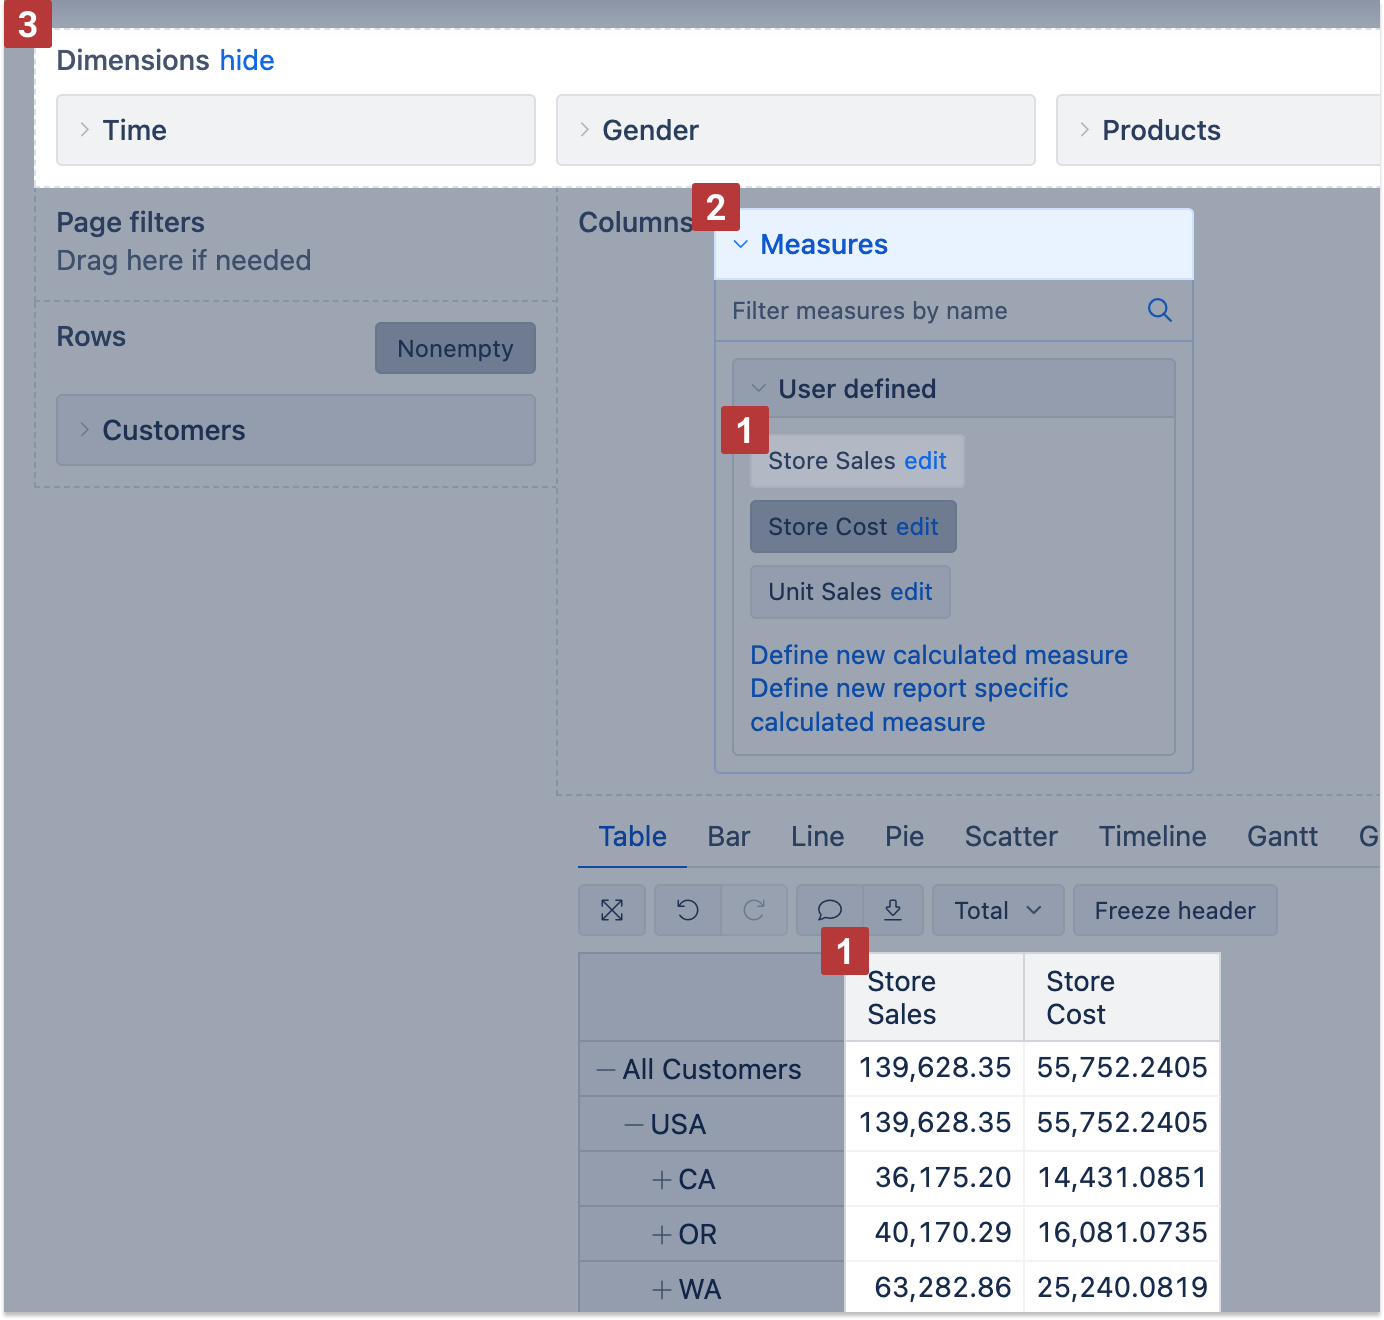
In the report, select dimensions across which you would like to analyze your data (measures). In this example, we aim to identify our top Customers based on their Sales volume.
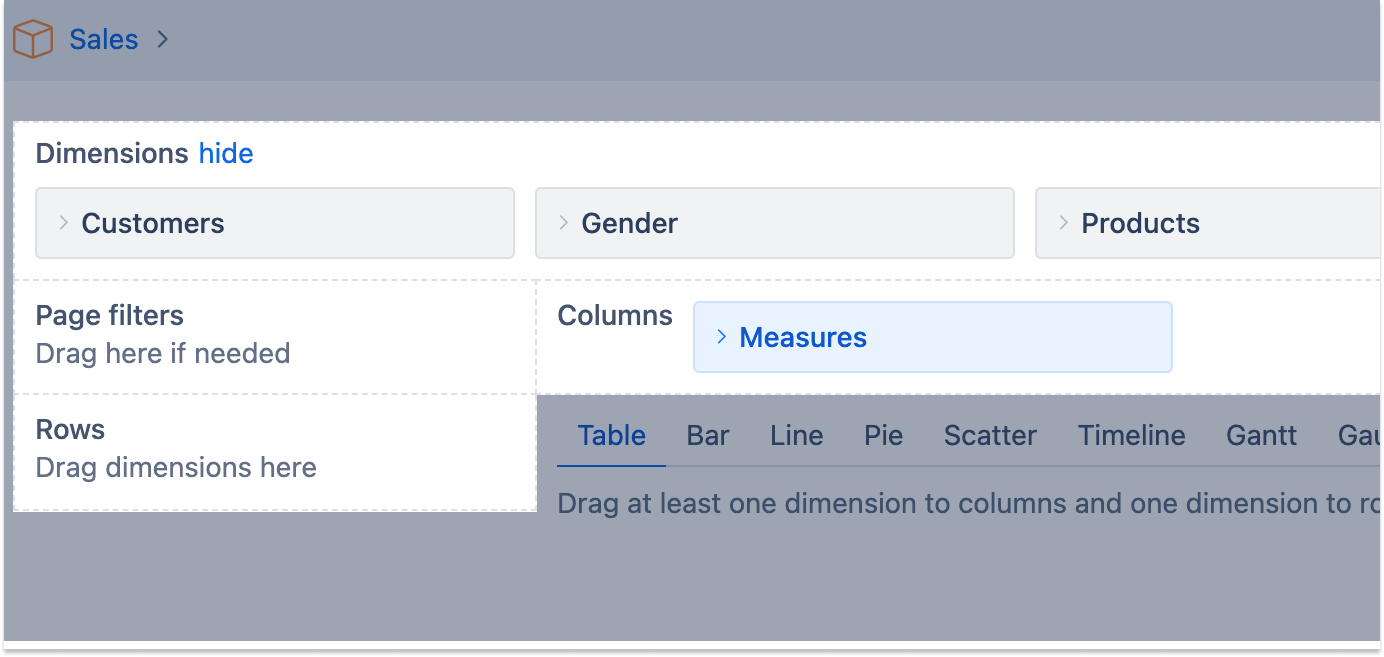
The report columns already select one or several default measures [1]. You can select measures you would like to analyze; a measure defines the report context and the relationship between the report dimension and the measure itself.
The Measures dimension is in report columns by default. You may move Measures [2] to Rows or Page filters, but you can't remove them from the report altogether.
When you select a dimension in the report rows or columns, the report results do not change; it only affects the layout of the report. Usually, Measures are selected in Columns and dimensions with many selected members on Rows.
After you have selected all the necessary dimensions for the report, you can hide the Dimensions section [3] to create more space for the report results.
Page filters
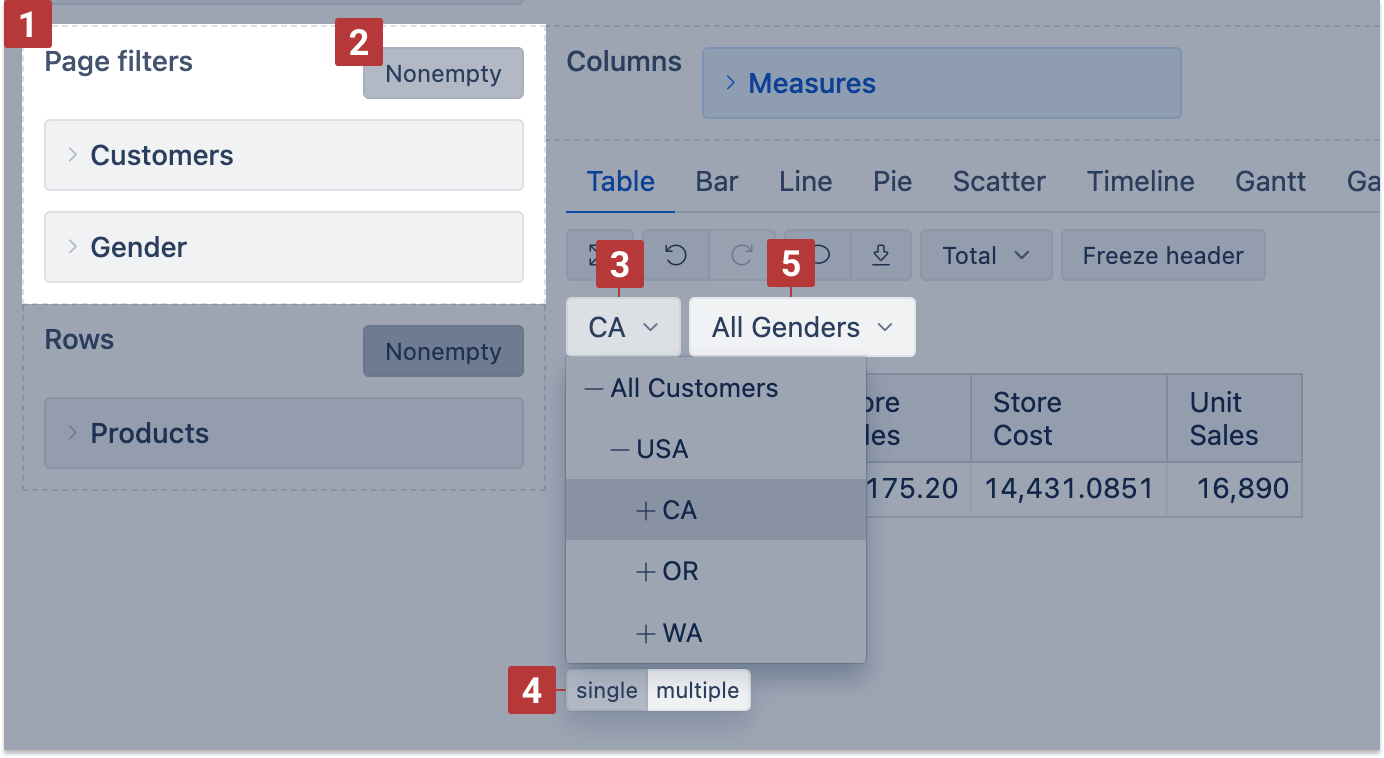
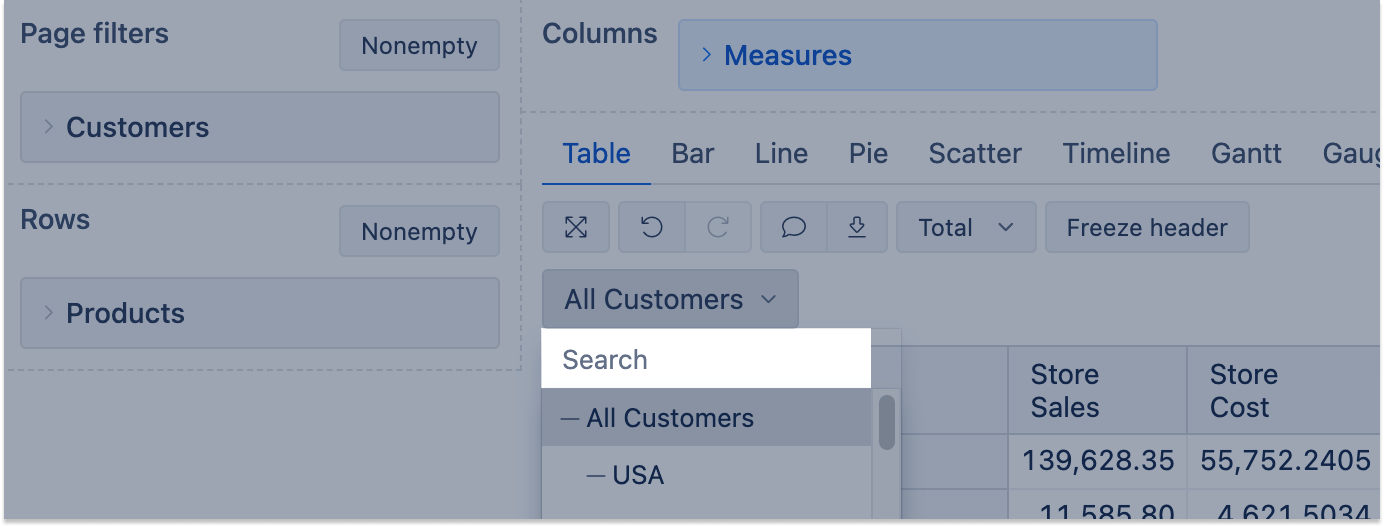
You can drag dimensions to the Page filters section [1] to filter report data. Select one or several dimension members from the filter drop-down list [3], and it will be applied to all measures of the report. By default, single select is enabled; you can enable multiple select with the "multiple" button at the bottom of the drop-down [4].
If multiple dimensions are in the page filters, an additional option Nonempty for Page filters is available to limit dimension members for the page filter drop-down lists [2]. The limitation is based on the dimension order.
The Nonempty option for page filter dimensions works from left to right. The leftmost dimension will always show all members regardless of the Nonempty setting. Only dimensions to the right [5] will be filtered based on selections made in dimensions to their left [3]
By default, all dimension members selected on rows will be visible, while Measures will be shown only where applicable based on the filter. If you wish to see only dimension members that have values for selected filters, click on the Nonempty option in the Rows section header. This will make a NonEmpty cross join with dimension members and selected stored measures - to show in rows just dimension members that have values based on the selected filter.
![]()
An additional search feature automatically appears in the page dropdown list when the dimension member list has 20 or more members.
Using the same dimension in Rows and Page filters
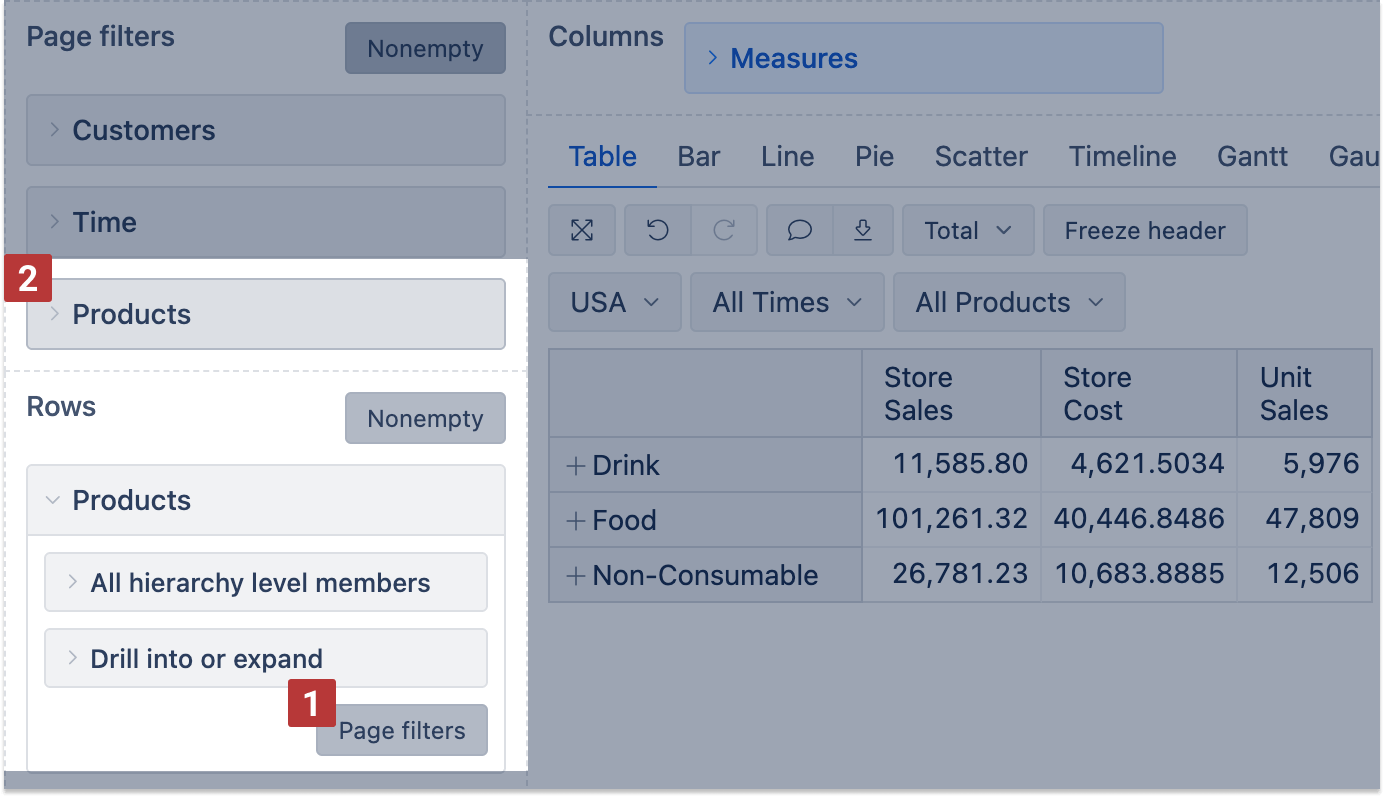
To filter the report by the members of the same dimension as you have in Rows, expand the dimension in the Rows section and click the Page filters [1] button that appears at the bottom of the expanded panel. This will add the same dimension to the Page filters section [2].
You can do the same for dimensions in Columns — expand the dimension in the Columns section and click the Page filters button to use the same dimension in both Columns and Page filters.
For example, add the Time dimension to both Rows and Page filters, and you can display months in rows and use the Page filter to select which year to show. If the dimension has multiple hierarchies, ensure that you use the same hierarchy in both the Rows and Page filters. When changing the hierarchy on Rows or Columns (for example, from the Time default hierarchy, which represents months, to a weekly hierarchy), also change it on Page filters.
See short video:
Group data by hierarchy levels
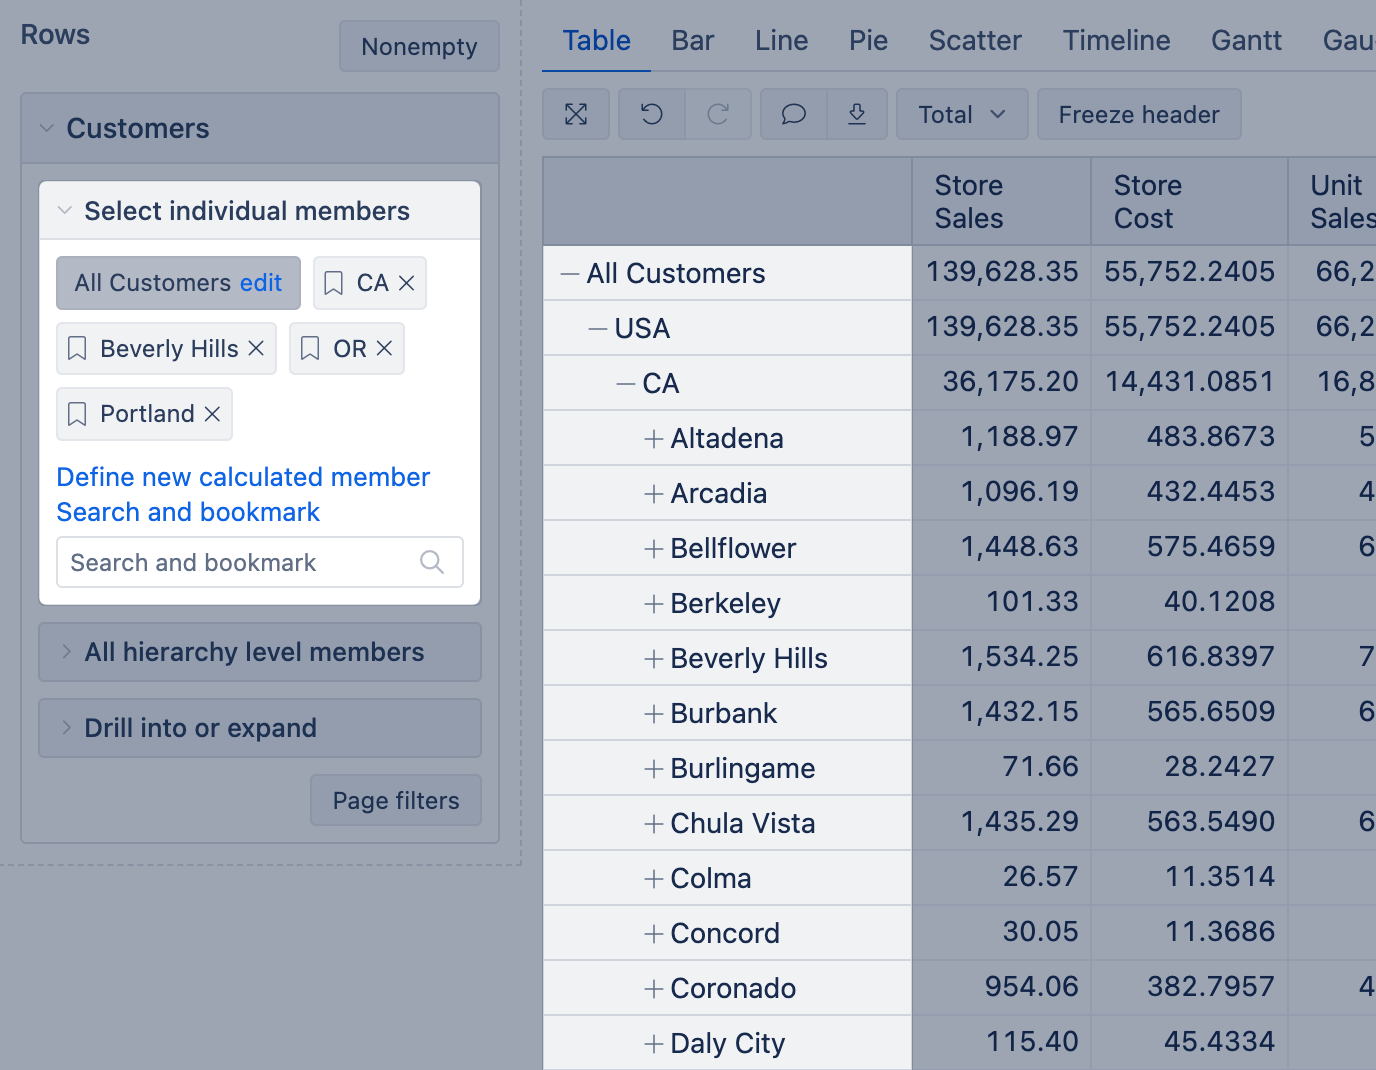
When you choose a dimension for the report rows, the data is shown at the highest level of the hierarchy by default (e.g., "All Customers").
Select one or multiple dimension members to report on. If you have the report admin role, you can select from existing calculated members or create new calculated members.
Use the "Search & bookmark" feature to find imported members you want to select for the report.
You can expand ( + ) and collapse ( - ) selected dimension members to show other hierarchy levels (e.g., start with all customers and expand into countries, regions, or states, cities, and individual customers).
All hierarchy level members
Instead of expanding hierarchy levels from the top, you can show all dimension members from a certain hierarchy level (e.g., all countries, states, provinces, cities, and customers) to show data grouped by this level.

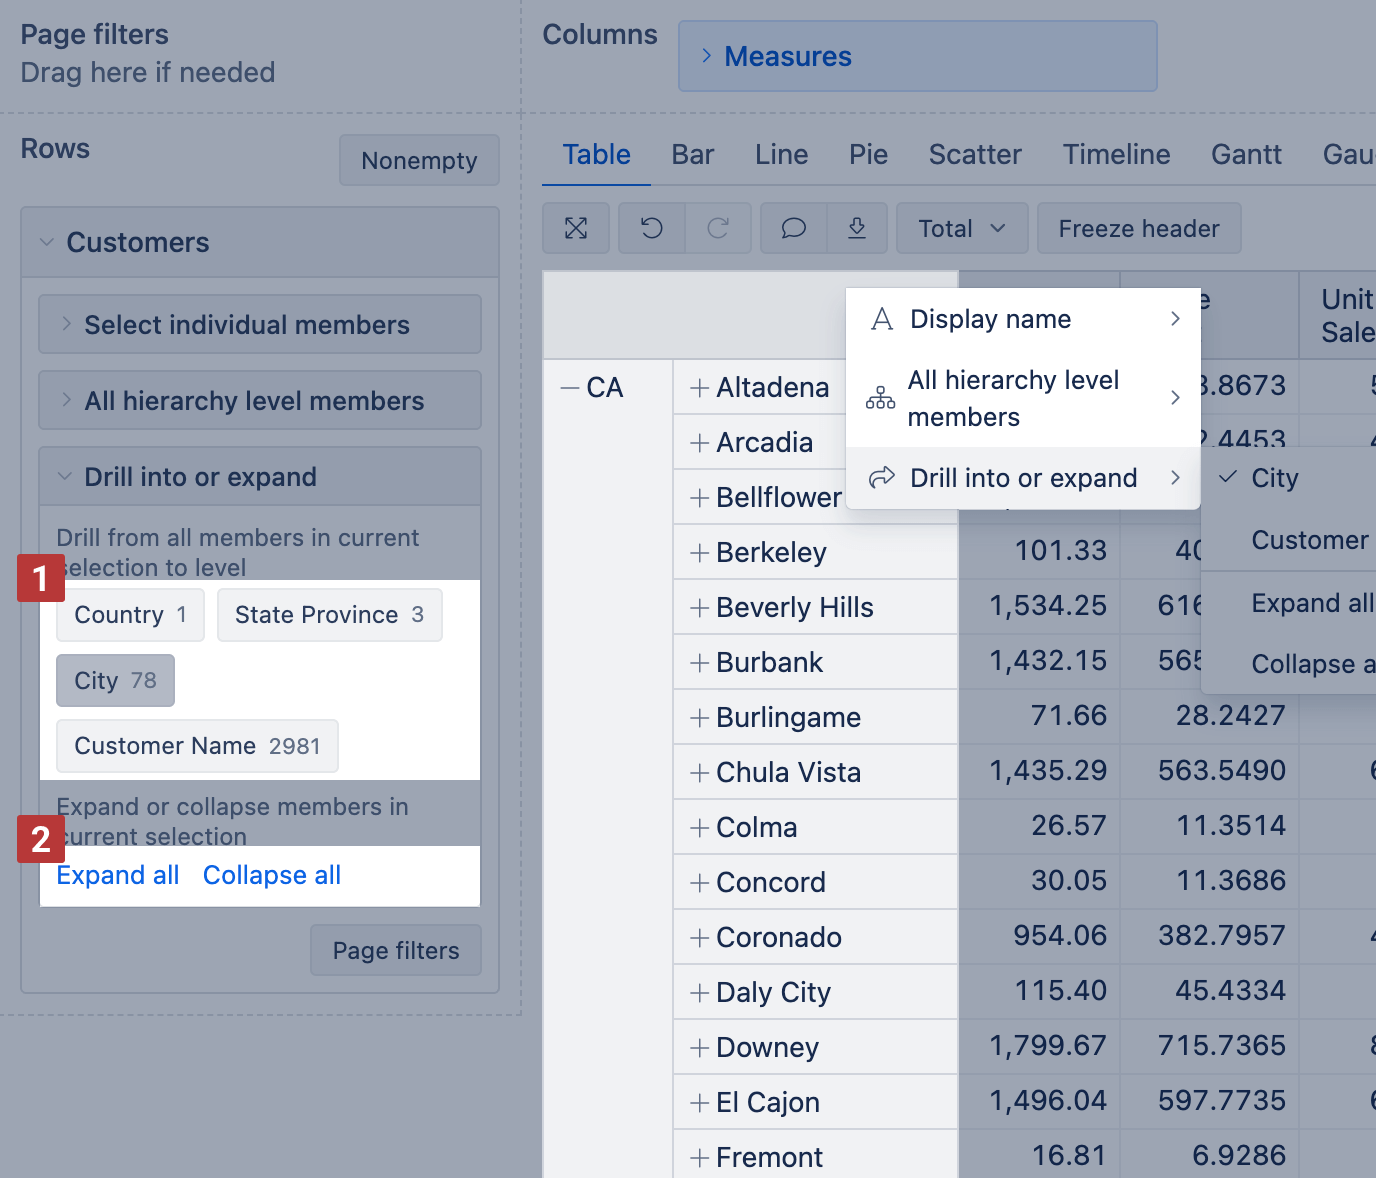
Drill into or expand dimension members
You can drill into or expand data at the lower levels of hierarchy. You can drill into either from the dimension column header or the dimension menu.
Select a level from the hierarchy [1] if you want to drill into a specific level (e.g., if you selected "State Province" level earlier for the report from "All hierarchy level members" menu, now you can drill into level City or Customer name)
Additionally, there is an option to Expand all and Collapse all [2] to interact with all members at once.
Order columns
The sequence of dimension members in rows or columns is set automatically. To rearrange them, bookmark dimension members and then add them to the report one by one in the needed order.
Another option is creating a calculated member in the same dimension with members in the correct sequence and then using this calculated member instead of the "All" hierarchy level members.
When measures (at least two) are selected in report columns, you can use drag-and-drop to change their sequence in the report.
See the short video on how to bookmark members:
Order rows
By default, all dimension members in eazyBI are sorted in ascending order by ID, name, or date, depending on the field data type.
When this dimension is expanded in report, its members are displayed in the default order.
There are several built-in options to order rows from a column header. You may order [1] [2] rows by the measure's value or select [2] top or bottom rows based on the chosen measure.
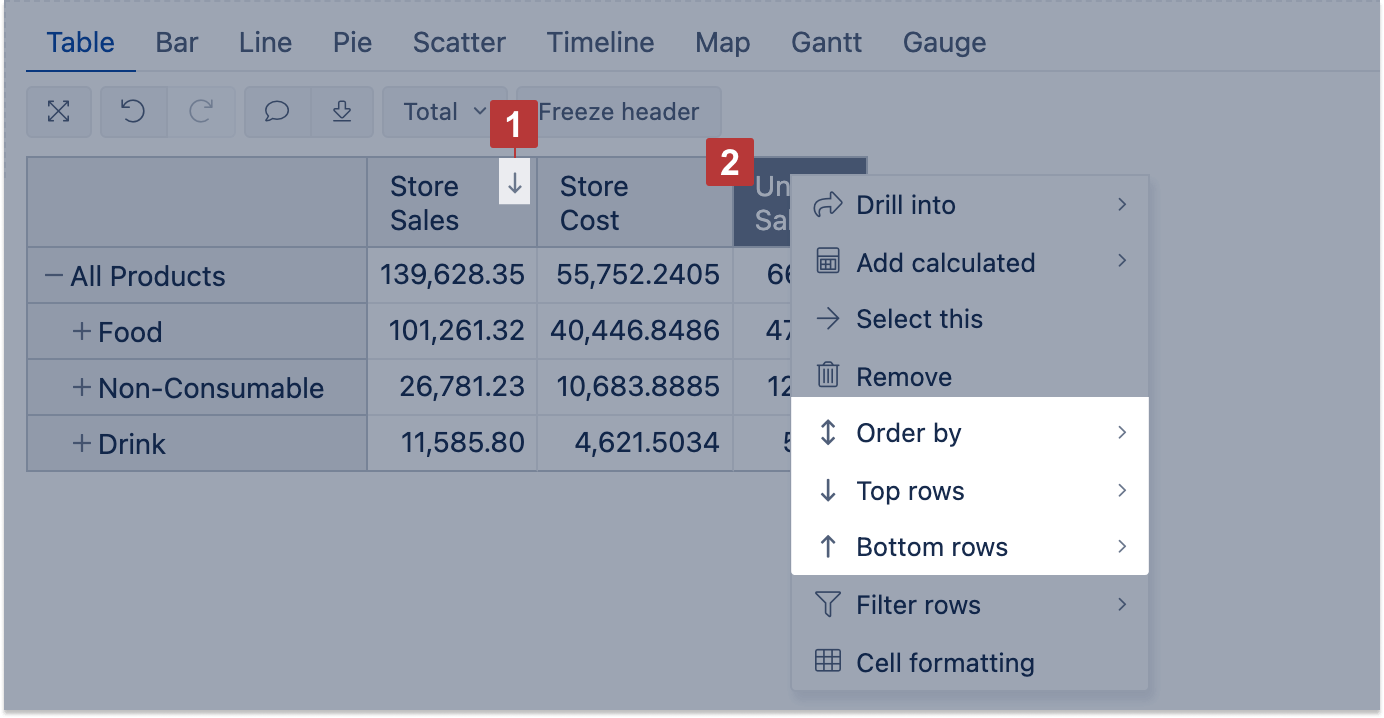
See a short video on how to use the Top rows filter in eazyBI:
Filter rows
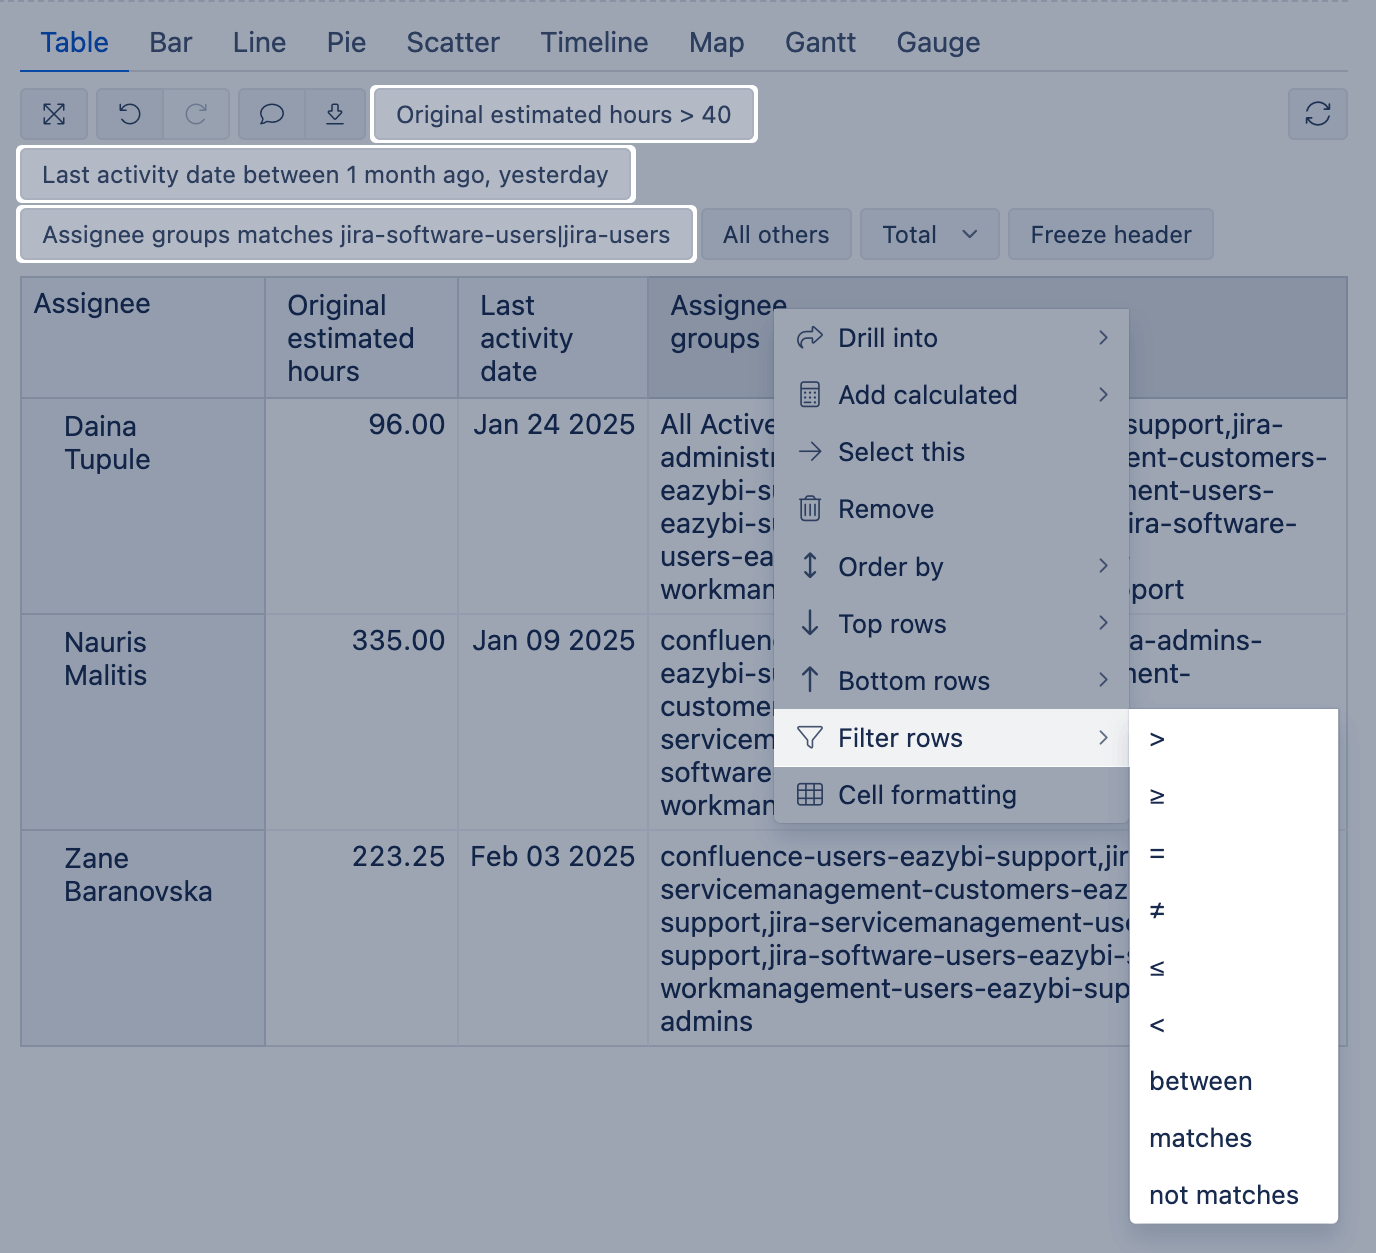
You can filter report data in several ways: using dimensions on report page filters or Filtering rows based on measure values (an option available when you click on the measure header).
- For string type values, pick operands matches or not matches. You can use regular expressions, for example, vertical bar
|to provide several value options. - For numeric type values, pick logical operands =, >, <, ≥, ≤, ≠ or between.
- For date type values, pick any of the operands and use exact or relative dates.
Drill into measure by another dimension level
By default, all measures selected in the report columns are cross joined by all members of the dimension selected in the columns with the measures. To cross join only one particular measure with a particular dimension level, you may use the option Drill into – click on the measure, select "Drill into" and the dimension and the level you need.

For example, if you select to drill into Customers dimension State Province level for measure Store Cost, the Customer dimension would be added to the report Columns next to the Measures and measure Store costs would split by Customer dimension State Province level members. Other measures won't be drilled into this dimension and will be left at the summary level.

Drilling into only one dimension for one measure is allowed in the same report. Changing order of dimensions in Columns (moving Measures after the added dimension) all measures will be drilled into this particular dimension level, which was added through the "Drill into" option.
You may remove the dimension by clicking on the same measure and using the Remove drill into option.
There are also some other report interaction features you can use.
Report Builder Assistant
Use the Report Builder Assistant when you need help creating reports and charts. This assistant can suggest report definitions and sample charts based on your needs. Specify what measures you want and what dimensions are on columns, rows, and page filters. Clarify when you want a detailed list of issues; otherwise, a summary report or chart will be created by default. You can also ask the assistant to explain eazyBI predefined measures.
Save report and toolbar buttons
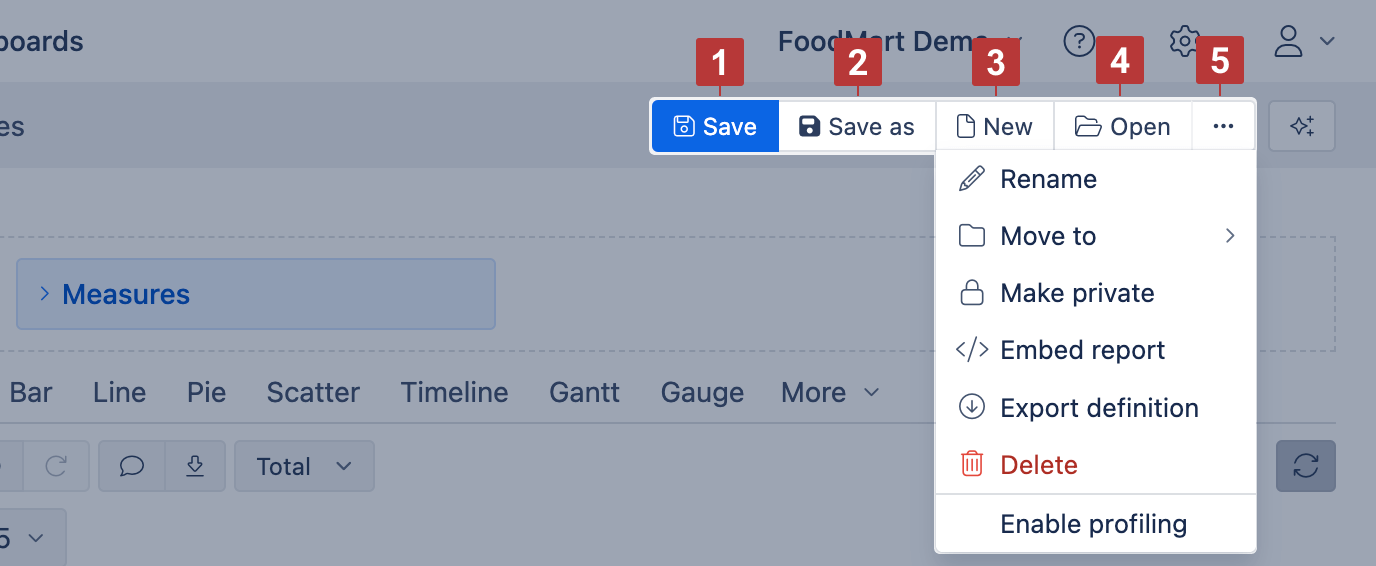
If you have created a report you would like to use later or you have modified the report or report specific measure and would like to save the changes, then save it from the report header toolbar [1]. If you edit the existing report and would like to save it as well as to keep the previous report, click the save as button [2] and give the report a name. This will save the new report and leave the previous report as it was. There are also other report actions in the report header toolbar, to create a new empty report or with current data selection [3], open another report [4], rename, move to report folder, mark report private, delete report, Export and import report definitions, or embed reports in other HTML pages or publish on wallboards [5].
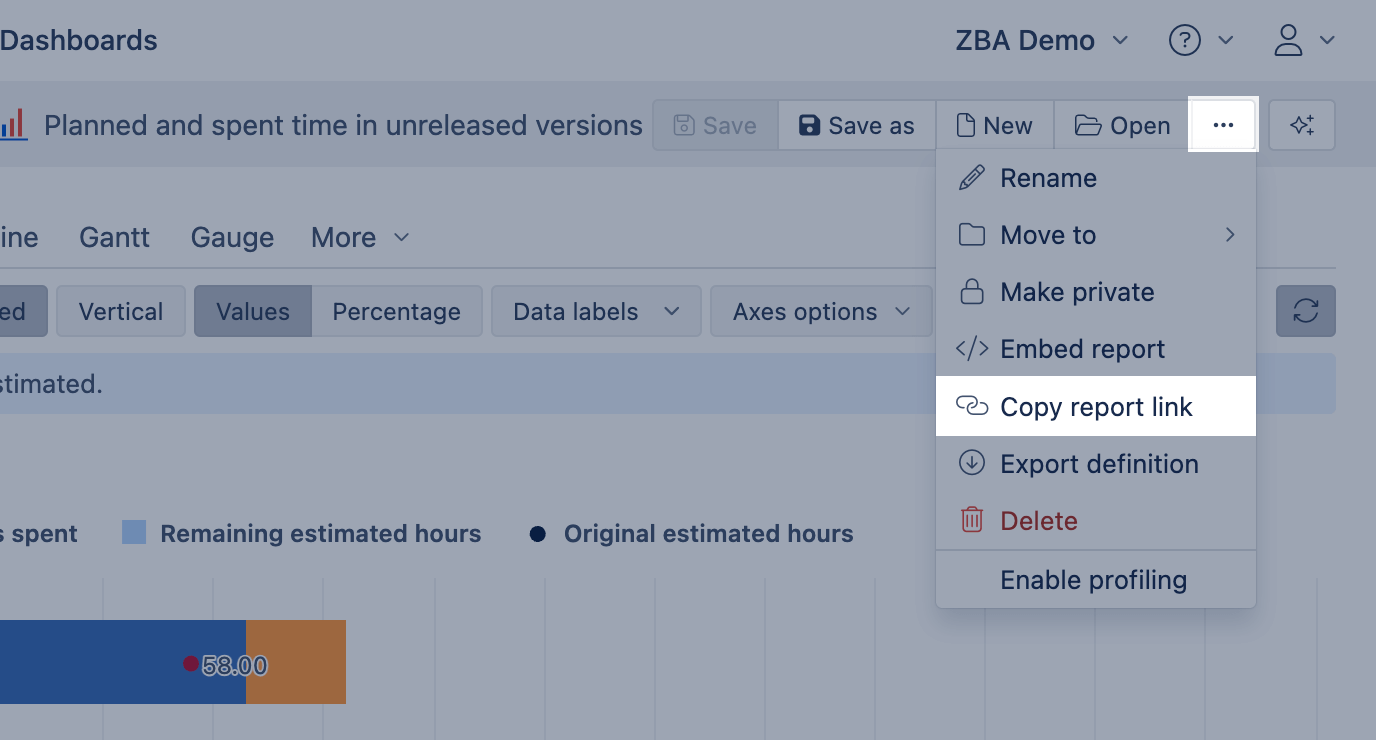
Copy report link
Copy the report link available on eazyBI for Jira Cloud and Confluence Cloud.
For other eazyBI product versions, you can copy the link from the browser address bar.
You can share the report with your colleagues by sending a link to the report location. Look for the Copy report link under more actions (three dots) on the report header toolbar. Then, copy the provided link.
This is the secure way to share the report location because only authorized users who have access to this report will be able to open it.