Freshdesk
eazyBI.com
Freshdesk is a cloud-based helpdesk software which streamlines customer conversations across channels like email, social media, phone, and chat. With a powerful suite of intuitive features, it makes it easy for teams to ensure a great support experience for customers.
eazyBI greatly extends Freshdesk reporting suite with an advanced, easy-to-use, and flexible visualization, analysis, and reporting system. You can connect to Freshdesk and perform your first import in minutes. Regular daily updates import date automatically, so your charts will always have the latest data.
When you connect to your Freshdesk account, we will prepare several predefined sample reports and charts to get you started. Then you can easily create custom reports, charts and dashboards for your specific needs.
Try eazyBI for Freshdesk live demo with sample reports and charts.
On this page:
Connecting to the Freshdesk Account
Add your Freshdesk to eazyBI. If you are using eazyBI for Jira and do not see the option to import data from Freshdesk, then you should enable this option in advanced settings for Data Center or site settings for Cloud.
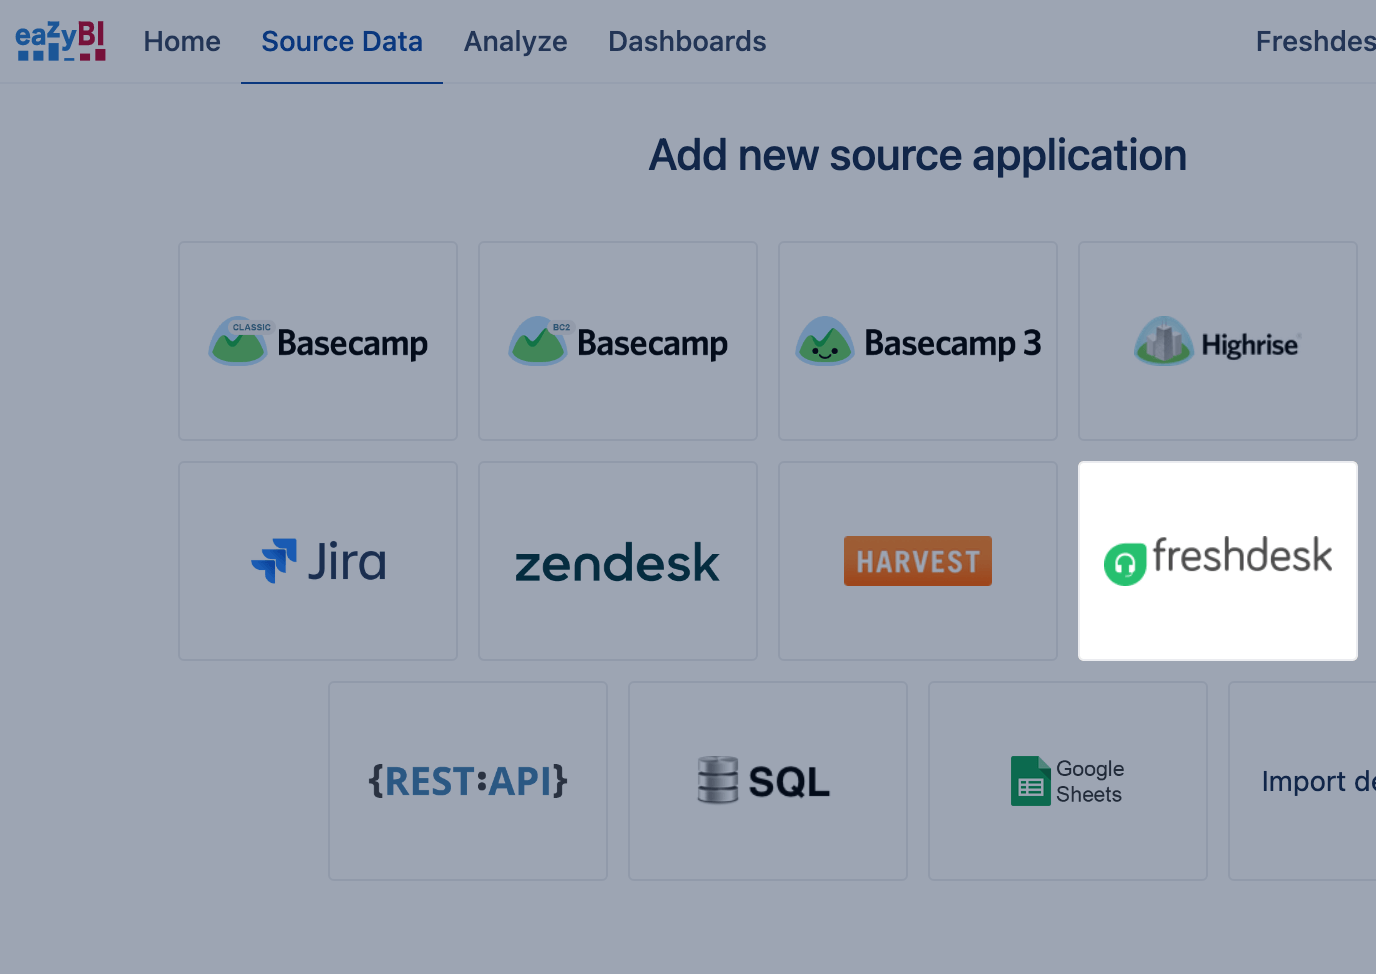
- In eazyBI open "Source Data" page, select "freshdesk" source application.
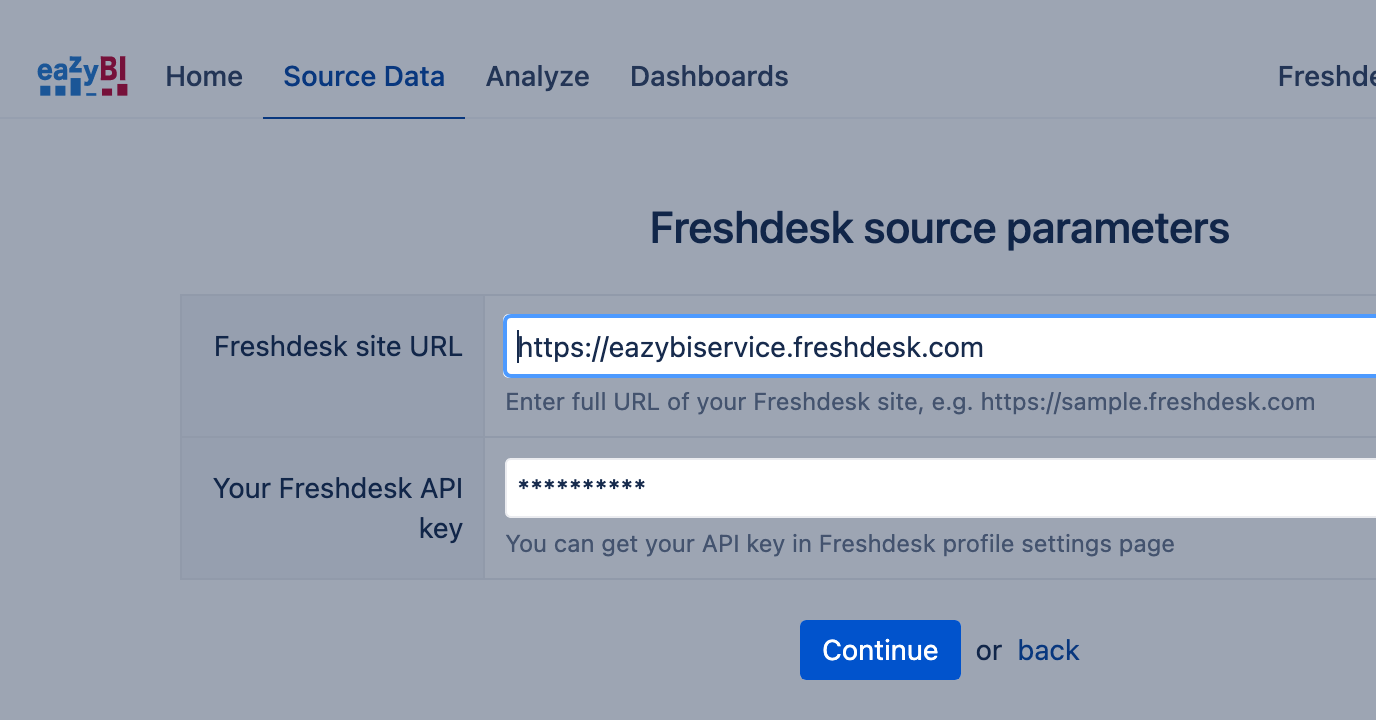
- Authorize eazyBI to import your Freshdesk account data. You will need to provide your Freshdesk site URL and user credentials, API token or user name and password.
- You would need to select a time frame for imported data. Set a date to fetch tickets updated on this date or later.
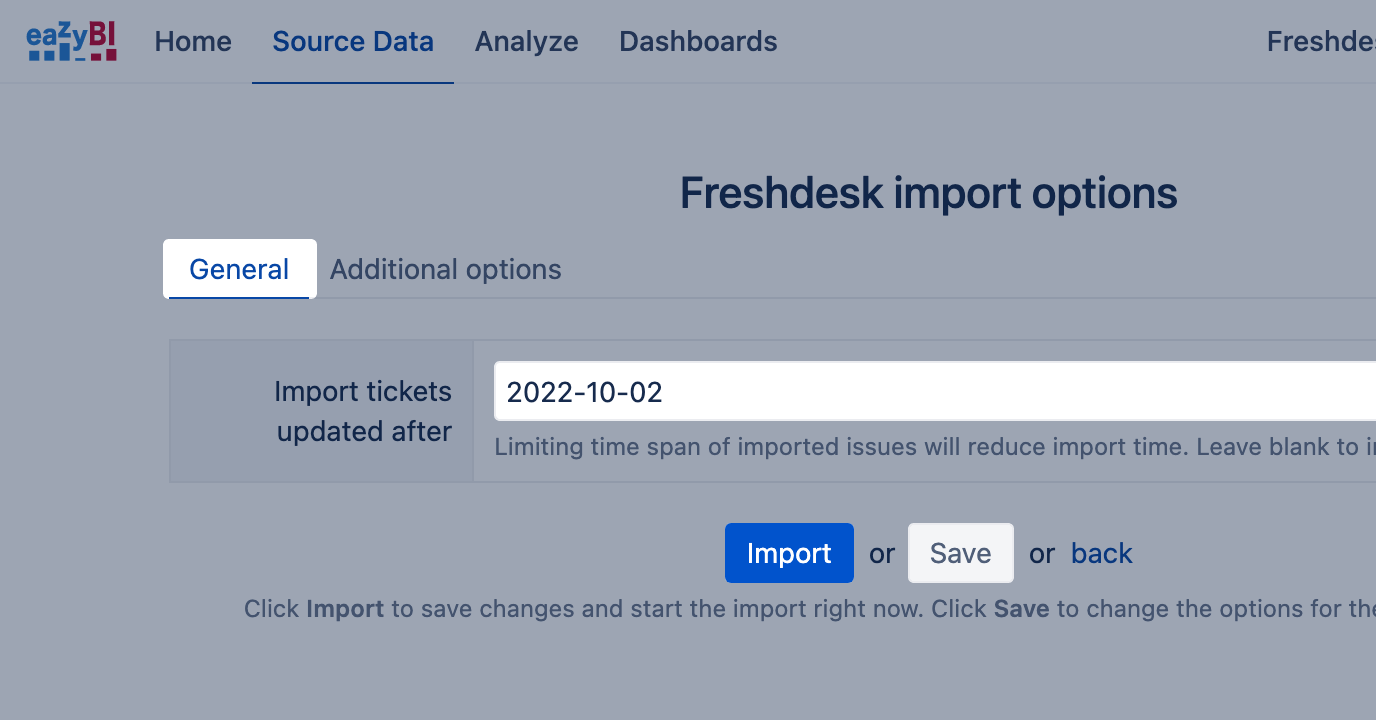
- You can apply settings for data import. An import will automatically import new Freshdesk data every day, using the selected authorization access.
Custom field data import
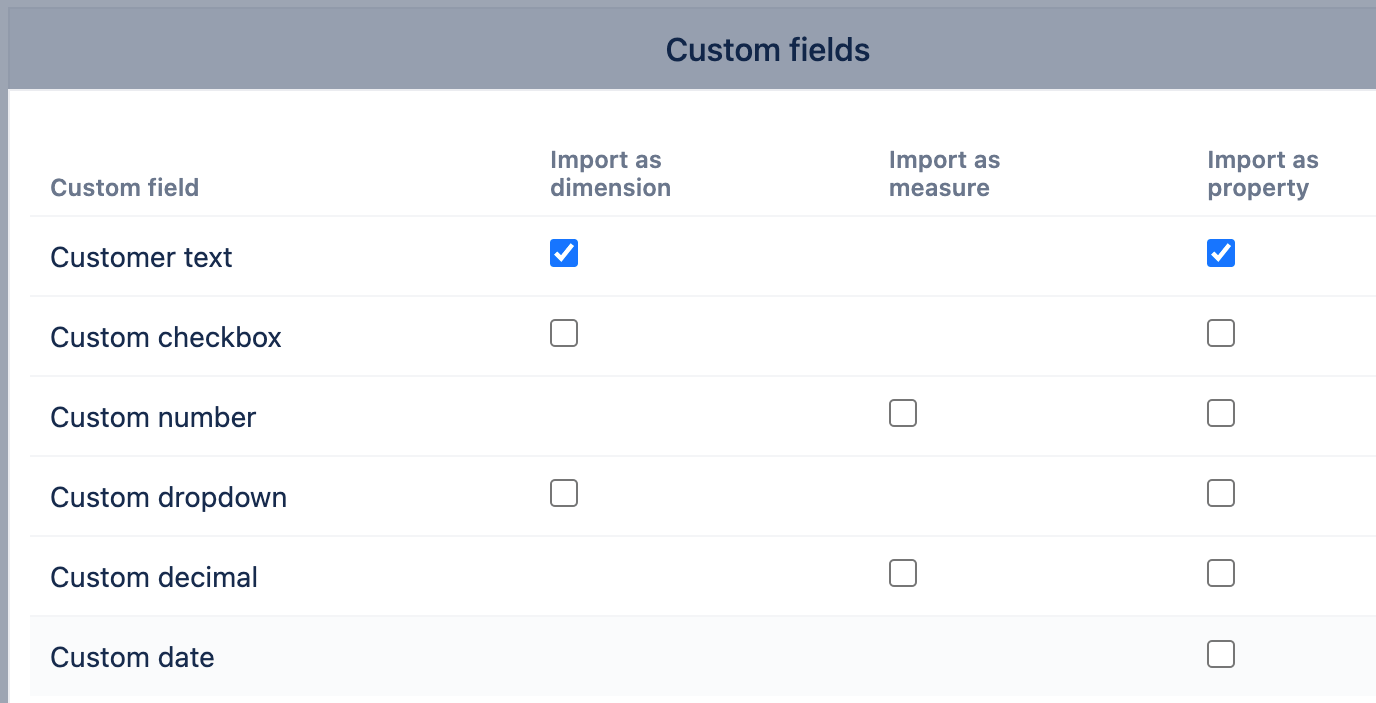
You can select Freshdesk custom fields for import. The list of all available custom field will show for selection. Custom fields with text, checkbox, and dropdown type can be imported as additional dimensions. Numeric custom fields can be imported as additional measures. All custom fields can be imported as properties for Tickets dimension (corresponding calculated measure “Ticket …” will be defined which will show custom field values for Ticket dimension detailed members). "Dependent Fields" custom field type is not supported in eazyBI currently.
For example, if you have custom field City with drop-down field type then you can import it both as a dimension and a property. You will be able to create reports by City dimension as well as you will have Ticket city calculated measure. If you will select Ticket dimension with all Ticket level members on rows then on columns you can select Ticket city calculated measure and will see City custom field value for each ticket.
If you need additional help with custom field import then please contact eazyBI support and describe your needs.
Additional import options
Each Service Desk agent in Freshdesk has an individual time zone. eazyBI will import data using UTC timezone by default. You would like to specify a timezone for your data import.
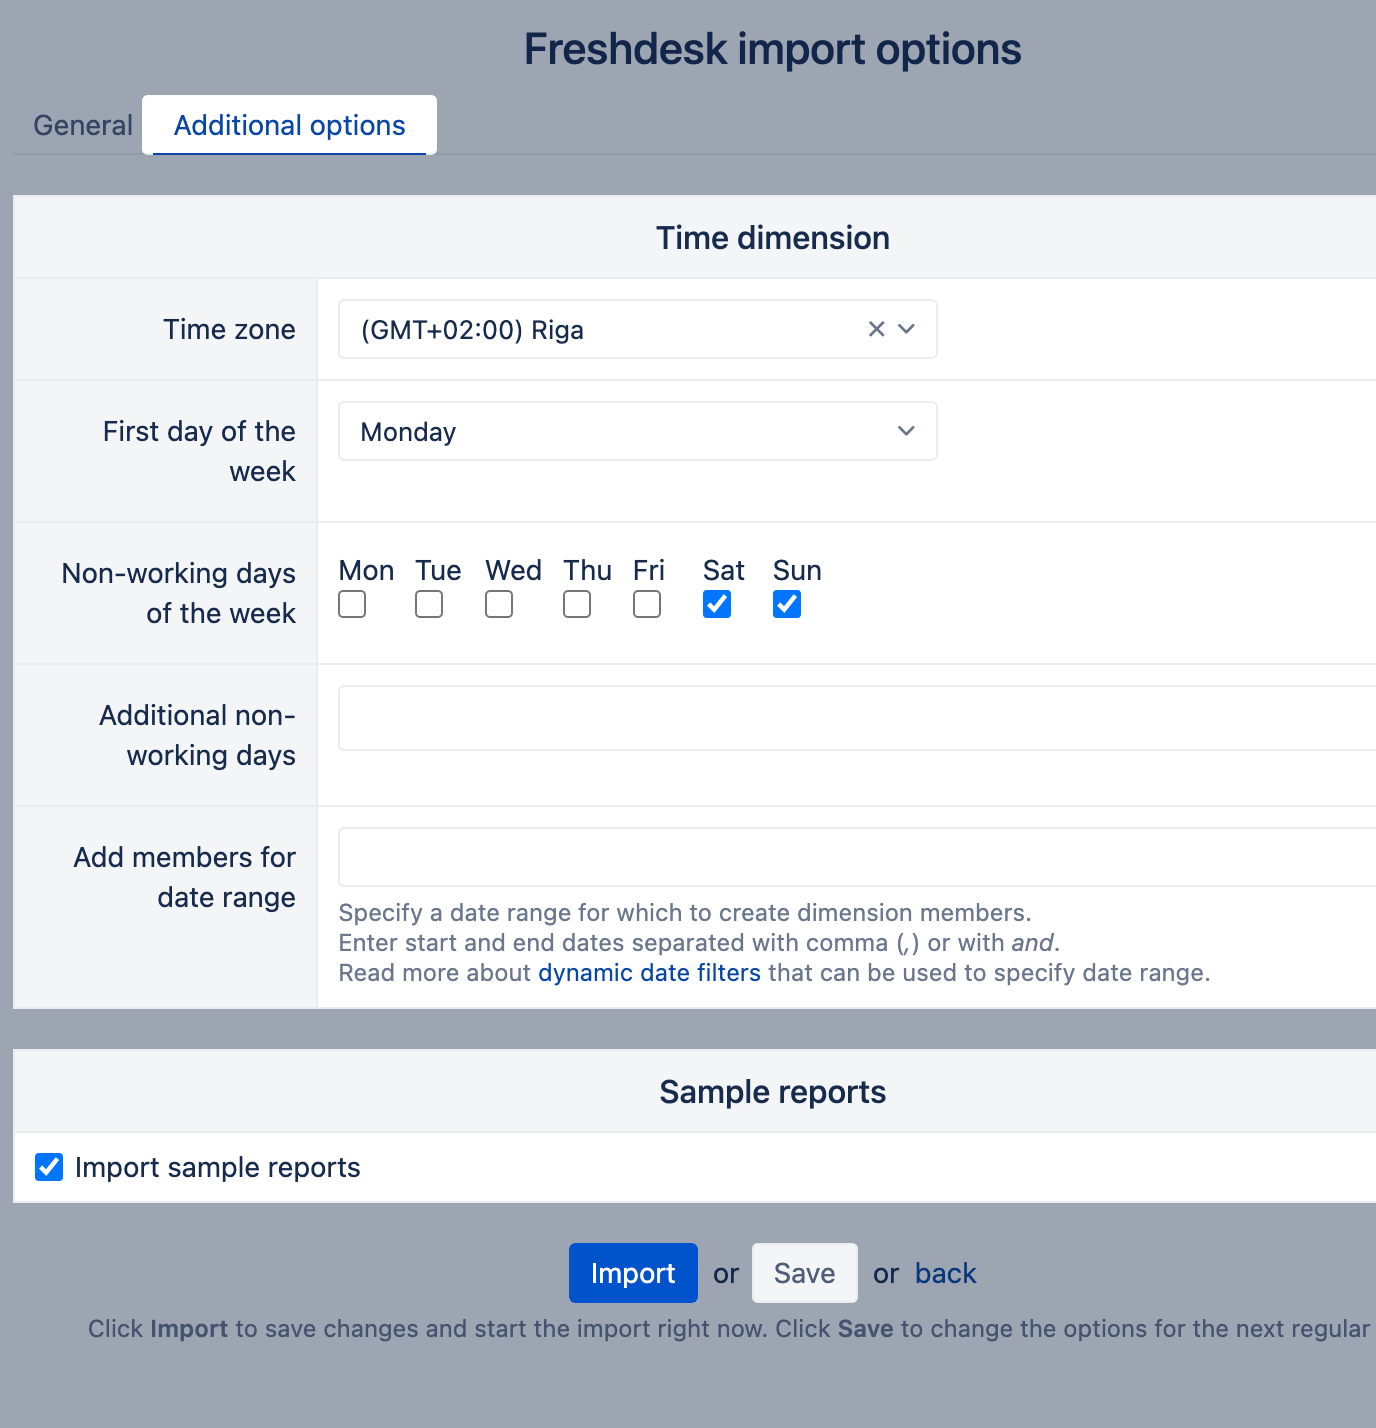
You can also deselect an option to import sample reports and dashboard in additional settings as well.
Imported data
eazyBI imports the following Freshdesk data (measures) and dimensions:
Tickets data cube measures
| Tickets created | The total number of created tickets that match selected dimension members. If the Time dimension is used then Tickets created are grouped by ticket creation dates and shown in a corresponding time period. |
|---|---|
| Tickets resolved | Resolved tickets which are in the Resolved or Closed status. On the Time dimension grouped by the ticket resolved date. |
| Tickets closed | Closed tickets which are in the Closed status. On the Time dimension grouped by the ticket closed date. |
| Tickets with due date | Tickets with due date. On the Time dimension grouped by the ticket due date. |
| Tickets reopened | Reopened tickets which were reopened at any time after resolution. On the Time dimension grouped by the ticket reopened date. |
| Tickets first responded | Number tickets with the first response. On the Time dimension grouped by the ticket first response date. |
| First response minutes | Number of minutes from ticket creation till the first reply. By default, it will show the total sum of minutes for all matching tickets. See below Add aggregate ticket measures to learn how to get average, mean, min, max or other aggregates of this measure (also available for other measures below). |
| Resolution minutes | Number of minutes from ticket creation till the the resolution. |
Closing minutes | Number of minutes from ticket creation till the till closing a ticket. |
Agent wait time | Number of minutes the agent spent waiting (on a contact response). |
Contact wait time | Number of minutes the contact spent waiting (on an agent response). |
Agent responses | Number of agent responses. On the Time dimension grouped by the agent response date. |
Contact responses | Number of contact responses. On the Time dimension grouped by the contact response date. |
Tickets data cube calculated measures
| Open tickets | Calculates the number of unsolved tickets at the end of the corresponding Time dimension period (as Tickets created minus Tickets resolved since the beginning of the time until the end of the selected Time period). |
|---|---|
First response - Compliant | First response SLA calculated measures shows a count of Compliant and Violated tickets and percentage of total responded tickets |
| Resolution - Compliant Resolution - Violated Resolution - Compliant % Resolution - Violated % | Resolution SLA calculated measures shows a count of Compliant and Violated tickets and percentage of total resolved tickets |
| Ticket created date Ticket resolved date Ticket closed date Ticket due date Ticket first response due date Ticket first response date Ticket reopened date Ticket is escalated Ticket status Ticket type Ticket priority Ticket source Ticket agent name Ticket contact name | If the Ticket dimension is placed on rows and expanded to detailed tickets and these measures are placed on columns then detailed field values of individual tickets are shown. |
Tickets data cube dimensions
Ticket measures and calculated measures can be analyzed by the following dimensions.
| Product | Product associated to tickets. |
|---|---|
| Time | Standard time dimension with the Year / Quarter / Month / Day hierarchy and the Year / Week / Day hierarchy. |
| Status | Current ticket status. |
| Type | Current ticket type or (none) if no ticket type is specified. |
| Priority | Current ticket priority or (none) if no priority is specified. |
| Contact | Users who created tickets (with Company and Contact hierarchy levels). |
| Agent | Current ticket assigned agent. |
| Group | Group which is assigned to tickets. |
| Source | Source by which tickets are created. |
| Tag | Current tags of ticket. If ticket has several tags then measure totals will be calculated for each tag. |
| Ticket | List of all individual tickets (with Product and Ticket hierarchy levels). Ticket dimension typically is not used for summary reports but can be used to all individual tickets which match certain filter criteria. |
SLA dimensions
Ticket measures and calculated measures can be analyzed by the following SLA dimensions as well.
| Closing interval | Product associated to tickets. |
|---|---|
| Escalated | Current ticket status. |
| First response SLA | Current ticket type or (none) if no ticket type is specified. |
| First response interval | Response time intervals of responded tickets. Learn more about interval dimensions. |
| Resolution SLA | Users who created tickets (with Company and Contact hierarchy levels). |
| Resolution interval | Resolution time intervals of resolved tickets. Learn more about interval dimensions. |
Add aggregate ticket measures
You can add different aggregates of Tickets data cube measures in your reports to analyze distribution of measure values across selected set of tickets.
For example, if you have added Full resolution time measure as column in your report then you can click on this column header and from Add aggregate select one of available aggregate functions:
Average
Will calculate average (or mean) measure value across all tickets which match current selected dimension values in your report and will add new column with this average measure value. E.g. average value from 1, 2 and 9 will be 6.Median
Will calculate median measure value across all matching tickets. E.g. median value from 1, 2 and 9 will be 2.Min, Max
Will get minimum or maximum measure value across all matching tickets.All quartiles
Will add Min, 1st quartile, Median, 3rd quartile and Max measure columns to your report.Percentile
Add any custom percentile aggregate measure. For example enter 90 for to see value which 90% of matching tickets do not exceed.
After adding aggregate function measure you can remove original measure column by clicking on column heading and select Remove.
Link from eazyBI reports to Freshdesk pages
In eazyBI reports you click on Ticket dimension member then in action list you will see Go to source link - when clicking on it new Freshdesk application page will be opened with corresponding data. It can be very useful to see summary overview in eazyBI and when necessary you can go to Freshdesk page for selected ticket.