
Oomnitza
eazyBI.com
Oomnitza is cloud-based helpdesk software that manages the lifecycle of technology portfolio assets, from onboarding to end of life. Oomnitza consolidates asset data from existing disconnected silos for endpoints, applications, Cloud, networking, and accessories.
eazyBI extends the Oomnitza reporting suite with an advanced, easy-to-use, and flexible visualization, analysis, and reporting. You can create an eazyBI account and perform your first import in minutes. Regular daily updates import data automatically, so your charts will always have the latest data. We have several predefined sample reports and charts, and a dashboard to get you started. You can easily create custom reports, charts, and dashboards for your specific needs.
eazyBI imports and allows data analysis for Assets, People (Users), and Locations.
Contact Oomnitza sales manager to enable eazyBI integration
On this page:
Dimensions
eazyBI imports this default set of dimensions:
| Asset | Non-archived assets grouped by asset type works with any asset measure and property |
|---|---|
| User | Users from section People works with any user measure and property |
| Locations | Represent location itself and assets, users by location. Works with any asset and user measure works with locations measures and properties |
| Created by | Users who created assets, users, and locations. Works with any asset, user, and location measures |
| Changed by | Users who made the latest update in assets, users, and locations. Works with any asset, user, and location measures |
| Asset Type | Represents Asset Type Located in section Asset and works with asset measures only |
| Asset Status | Represents the status of the asset. Located in section Asset and works with asset measures only |
| Asset Assigned to | Represents the user an asset is assigned to. Located in section Asset and works with asset measures only |
| User Role | Represents the role of the user. Located in section User and works with user measures only |
| Asset Transition Status | All statuses that appear in transitions (the same statuses as in the Asset Status dimension) |
| Asset Transition | All individual transitions with names in the format “From status => To status” |
Asset measures and properties
Set of measures that are imported based on Asset data and work primarily with Asset dimensions and common dimensions, like Location, Created by, Changed by.
| Assets created | Measure counts assets on a timeline based on Asset creation date |
|---|---|
| Assets changed | Measure counts assets on a timeline based on the last date when the asset was changed |
Transitions to asset status | How many times during the selected Time dimension period asset has been transitioned to the status that is selected in the Asset Transition Status dimension (or only transitions that are selected in the Asset Transition dimension). Also, first, asset status will be counted in this measure on the asset creation date. If you would like to see a distinct (unique) count of assets for these transitions then use Assets with transitions to status measure |
| Transitions from asset status | How many times during the selected Time dimension period asset has been transitioned from the status that is selected in the Asset Transition Status dimension to different status (or only transitions that are selected in the Asset Transition dimension) If you would like to see a distinct (unique) count of assets for these transitions then use Assets with transitions from status measure |
| Assets with transitions to status | How many (unique) assets have transitioned to the selected status in Asset Transition Status dimension (or only transitions that are selected in Asset Transition dimension) during the period chosen in Time dimension |
| Assets with transitions from status | How many (unique) assets have transitioned from selected status in Asset Transition Status dimension (or only transitions that are selected in Asset Transition dimension) during the period chosen in Time dimension |
| Hours in transition status | Hidden measure How many hours asset has stayed in status from Asset Transition status dimension. It is calculated when an asset is transitioned from this status (when the Transitions from asset status measure is recorded) and will be shown on Time dimension on the date when the transition from this status happened. Use Average days in transition status calculated measure when you are analyzing totals of many assets |
| Asset Created Date | Asset property represents a date when an asset was created |
| Asset Changed Date | Asset property represents a date when an asset was last changed |
| Asset Created By | Asset property represents a user who created an asset |
| Asset Changed By | Asset property represents a user who last changed an asset |
| Asset Assigned To | Asset property represents a user who is currently assigned to an asset |
| Asset Type | Asset property represents a type of an asset |
| Asset Location | Asset property represents a location of an asset |
| Asset Status | Asset property represents a current status of an asset |
| Asset Tag | Asset property represents a tag of an asset |
User measures and properties
Set of measures and properties that are imported based on User data and work with dimension User, and common dimensions, like Created by, Changed by.
| Users created | Measure counts users on a timeline based on user creation date |
|---|---|
| Users changed | Measure counts user on a timeline based on the last date when the data for a user was changed |
| User Created Date | User property represents a date when a user was created |
| User Changed Date | User property represents a date when user data was last changed |
| User Created By | User property represents a user who created a user |
| User Changed By | User property represents a user who last changed user |
| User role | User property represents the role of the user |
| Current username | User property represents the username of the user. Could be used with function CurrentUser() |
Location measures and properties
Set of measures and properties that are imported based on Location data and work with dimension Location, and common dimensions, like Created by, Changed by.
| Locations created | Measure counts users on a timeline based on location creation date |
|---|---|
| Locations changed | Measure counts user on a timeline based on the last date when the data for the location was changed |
| Location Created Date | Location property represents a date when a location was created |
| Location Changed Date | Location property represents a date when location data was last changed |
| Location Created By | Location property represents a user who created a location |
| Location Changed By | Location property represents a user who last changed a location |
| Location Latitude | Location property represents a coordinate latitude value to show location on a map |
| Location Longitude | Location property represents a coordinate longitude value to show location on a map |
Asset calculated measures
| Assets in transition status | How many assets at the end of the selected Time dimension period are in a status that is selected in the Asset Transition Status dimension (calculated as Asset Transitions to status minus Asset Transitions from status from the beginning of time until the end of the selected Time period) |
|---|---|
Average days in transition status | Average days that asset stayed in the status that is selected in the Asset Transition status dimension. It is calculated when an asset is transitioned from this status (when the Asset Transitions from status measure is recorded) and will be shown on the Time dimension on the date when the transition from this status happened |
| Transition to asset status first date | Shows the date and time when the first transition to the corresponding Asset Transition Status (or the selected Asset Transition) was performed |
| Transition to asset status last date | Shows the date and time when the last transition to the corresponding Asset Transition Status (or the selected Asset Transition) was performed |
| Transition from asset status first date | Shows the date and time when the first transition from the corresponding Asset Transition Status (or the selected Asset Transition) was performed |
| Transition from asset status last date | Shows the date and time when the last transition from the corresponding Asset Transition Status (or the selected Asset Transition) was performed |
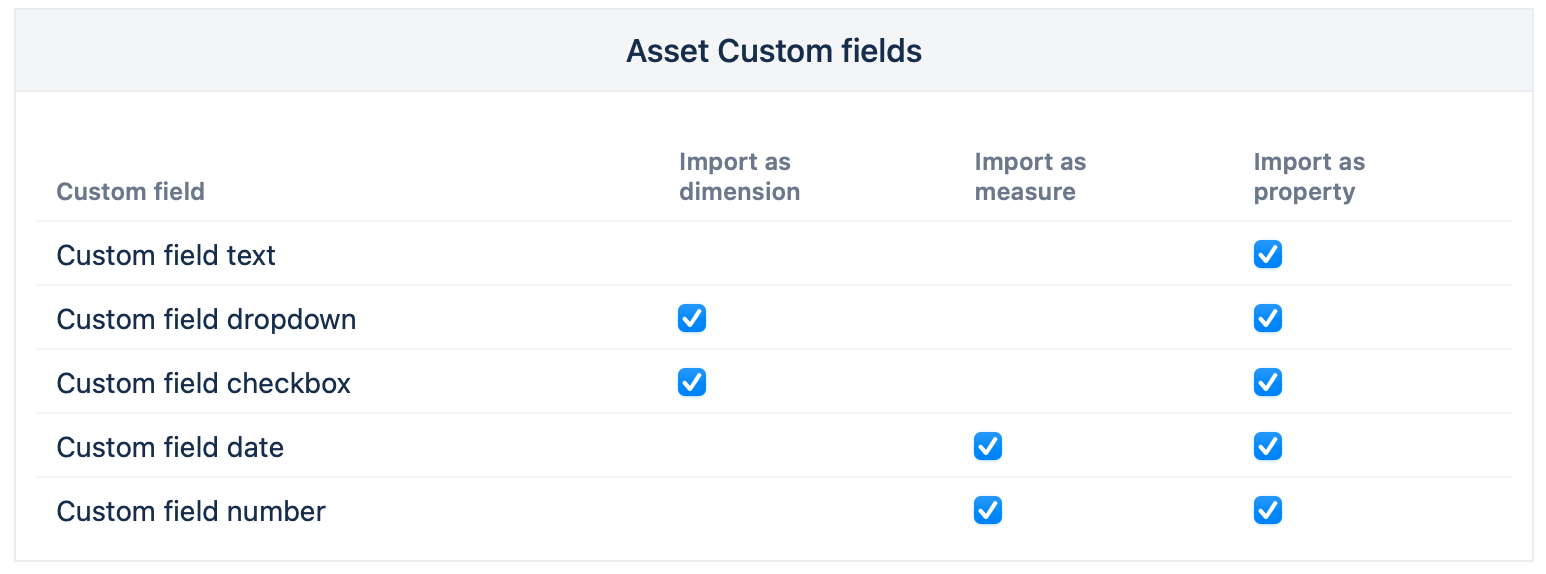
Custom field data import
You can select additional custom fields for import. The list of all available custom fields will show for selection grouped by sections Assets, Users, and Locations. Custom fields with checkbox, dropdown type, user list, location can be imported as additional dimensions. Numeric, and date custom fields can be imported as additional measures. All custom fields can be imported as properties for related dimensions. They will be grouped in sections ending with properties (Asset properties, User Properties, Location properties).
Numeric custom fields can be imported as measures and property. The measure will have a name ending Custom number sum. It will be represented on a timeline mapped with the asset creation date. For example, the custom field Purchase Price imported for Asset will be located in the section Asset with the name Asset Purchase Price sum. It also will have property located in Assets Properties with the name Asset Purchase Price.
Date custom field can be imported as a measure and will create a measure ending with custom date. It counts entities with value in this date on the timeline mapped by the date value. For example, the custom field Purchase date imported for Asset will be located in the section Asset with a name Assets with Purchase Date. It also will have property located in Assets Properties with a name Asset Purchase Date.
checkbox, dropdown type, user list, location fields can be imported as dimensions. Use them in reports for filters or to split data with measures. For example, if you have a drop-down selection custom field Model for Assets then you can import it as a dimension. You will be able to create reports by Asset Model dimension as well as you will have Asset property Asset Model.
Use custom dimensions in the report to split data by any measure. For example, Use dimension Time on Rows, dimension Asset model on Columns, and measure Assets with purchase date on Columns. This report will show assets by purchase date on a timeline split by asset model.
If you need additional help with custom field import then please contact eazyBI support and describe your needs.
Additional import options
eazyBI by default will import data on daily basis since taking into account the last successful import run. You can set daily imports at a specified time as well or disable regular imports.
eazyBI will import data based on the specified timezone. For reporting on workdays/weekends set the correct non-working days. For weekly reporting set the first day of the week.
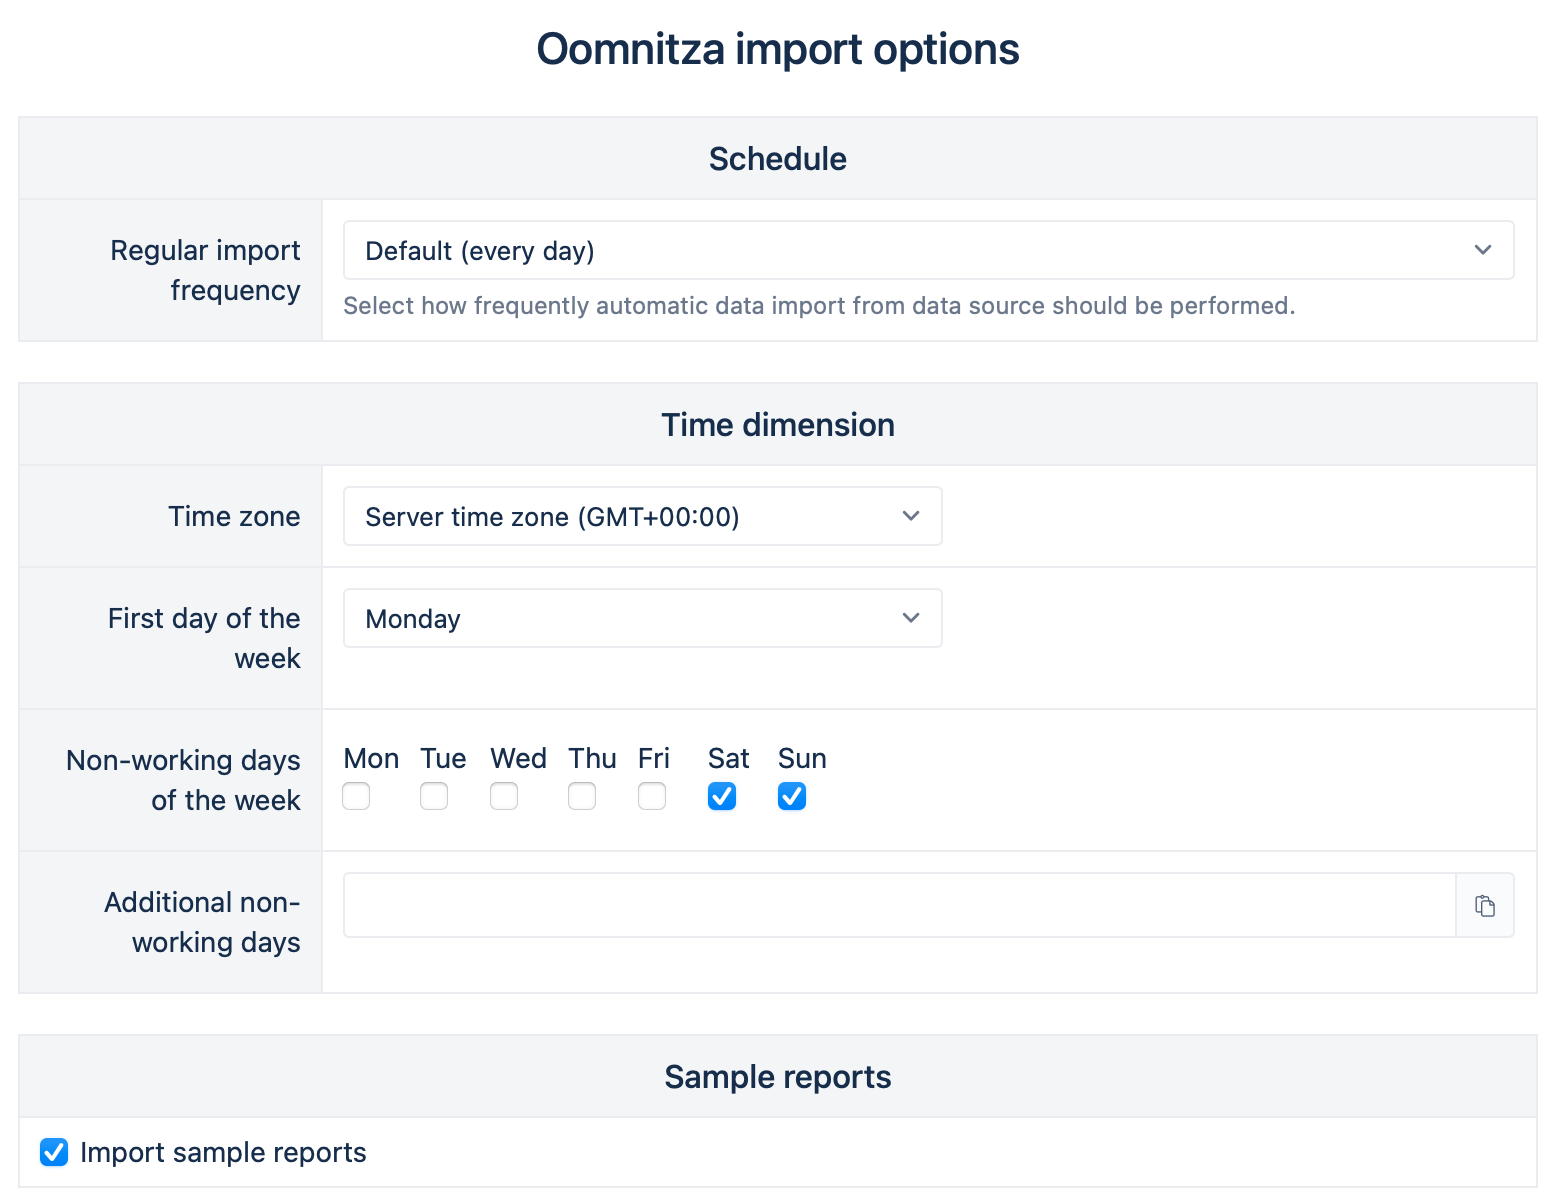
eazyBI will import a set of sample reports by default. The option can be disabled and the default set of reports will be deleted.
Using in Oomnitza dashboards
Use sample reports or create new custom reports and charts. Organize sample and custom reports in eazyBI dashboards. Publish eazyBI dashboards in the Oomnitza dashboard to access the key reports in instant. Create a new Oomnitza dashboard and select the dashboard type eazyBI. Select the account and the dashboard you would like to see and save results.