Average change lead time detailed
eazyBI for Jira
On this page:
Overview
This report shows the part of the issue life cycle starting from the development moment and until delivery to production.
How to build it
To build this report start with the table view and drag and drop Project dimension in Rows, select the "Project" level to see data per each project. Add "Project" dimension into Pages and select projects that have related DevOps metrics. When eazyBI creates sample reports then the top 3 projects are automatically selected.
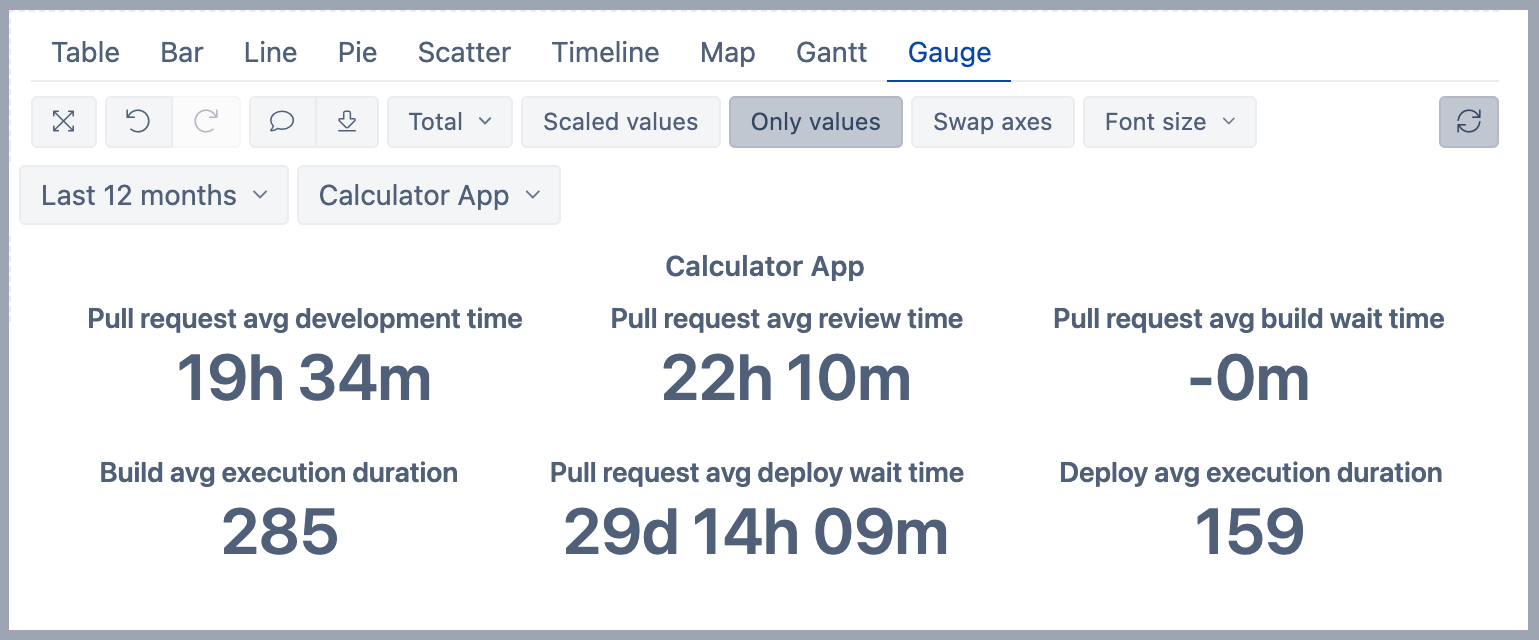
Unselect default measure "Issues created". Then in the Measures dimension, select measures:
- Pull request avg development time - the time between the first commit time and pull request creation in Bitbucket.
- Pull request avg review time - the time between pull request created and closed dates.
- Pull request avg build wait time - the time between pull request closed date and build creation date.
- Build avg execution duration - Bamboo build execution time in seconds.
- Pull request avg deploy wait time - the time between pull request closed date and deployment creation date.
- Deployment avg execution duration - Bamboo deployment execution time in seconds.
Add Time dimension to Pages. Select member Last 12 months and apply this member in Page filter.
Switch to the Gauge tab and in the toolbar select option Only values.
See also
- Learn about different DevOps measures and hidden dimensions - what they are and how they work.
- See more about options that are available when you create a report.
- Learn how to modify different chart types.
- See training videos to learn more.