
Average change and recovery time
eazyBI for Jira
On this page:
Overview
In this report, you can see how much time it takes for a new idea to get implemented and deployed. How long does it take from the moment of opportunity to the moment you can actually use it in the product? Shortening Average Time to Change time means customers can react to market changes and requirements faster.
This measure is coupled with the Average Recovery time to give an overview of the environment. This second measure shows the time it takes to recover after an incident is raised; commonly measured as production downtime.
How to build it
To build this report, start with the table view and drag and drop the Project dimension in Rows; select the "Project" level to see data per each project. Add the Project dimension into Pages and choose projects with related DevOps metrics. When eazyBI creates sample reports, then the top 3 projects are chosen automatically.
Then, in the Measures dimension, select measures Average Time to Change and Average Recovery Time and unselect default. measure "Issues created".
"Average Time to Change" - average days from issue creation to resolution for issues that are not with Incident issue type.
"Average Time to Recovery" - average resolution days for incidents (issues with pre-defined incident issue types).
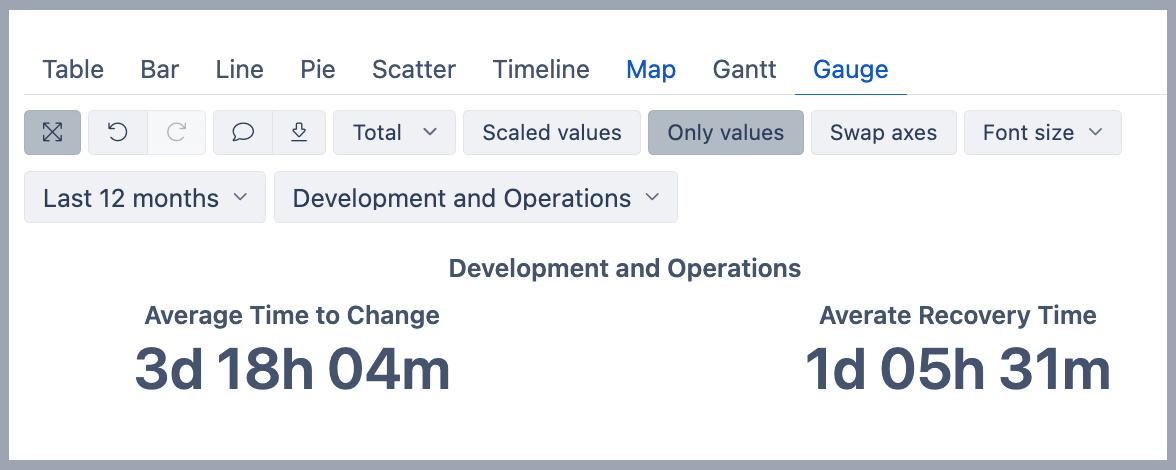
Add Time dimension to Pages. Select the member's Last 12 months and apply this member in the Page filter.
Switch to the Gauge tab, and in the toolbar, select option Only values.
See also
Learn about different DevOps measures and hidden dimensions - what they are and how they work.
See more about options that are available when you create a report.
Learn how to modify different chart types.
See training videos to learn more.