Best practices for report creation
Creating reports can be a complex process. In addition to understanding your business case and reporting needs, you also have to consider how to achieve your goal using the reporting tool — eazyBI, in this case.
First, decide which dimensions and measures will best display the information you need. Then, make sure the report is built in an optimal way to ensure it runs efficiently and returns results quickly.
There is no single "perfect" way to create reports. However, there are best practices that can guide you on the technical steps to follow. These steps are especially important if you plan to share reports as templates with other accounts, as those accounts may have different data volumes and different types of end users.
Even if you create a report with the AI Assistant's help, we recommend checking it against best practices.
On this page:
Guidelines for report building
The recommended way to build an optimal report.
1. In Rows, select one or two dimensions, avoid selecting more
- If you can not decide if dimensions should be used in rows and columns, always use a dimension with more members in rows.
- If you think you need more dimensions in the report, remember about option Drill across: it can be used at any time in the final report to analyze data by any other dimension you need, you do not need to add this dimension in the report structure "just for case".
- If you need to split only one measure by some dimension, then better use the option Drill into dimension for this measure instead of selecting it in the report rows.
- Time dimension usually goes on rows as it allows you to use the timeline chart as well.
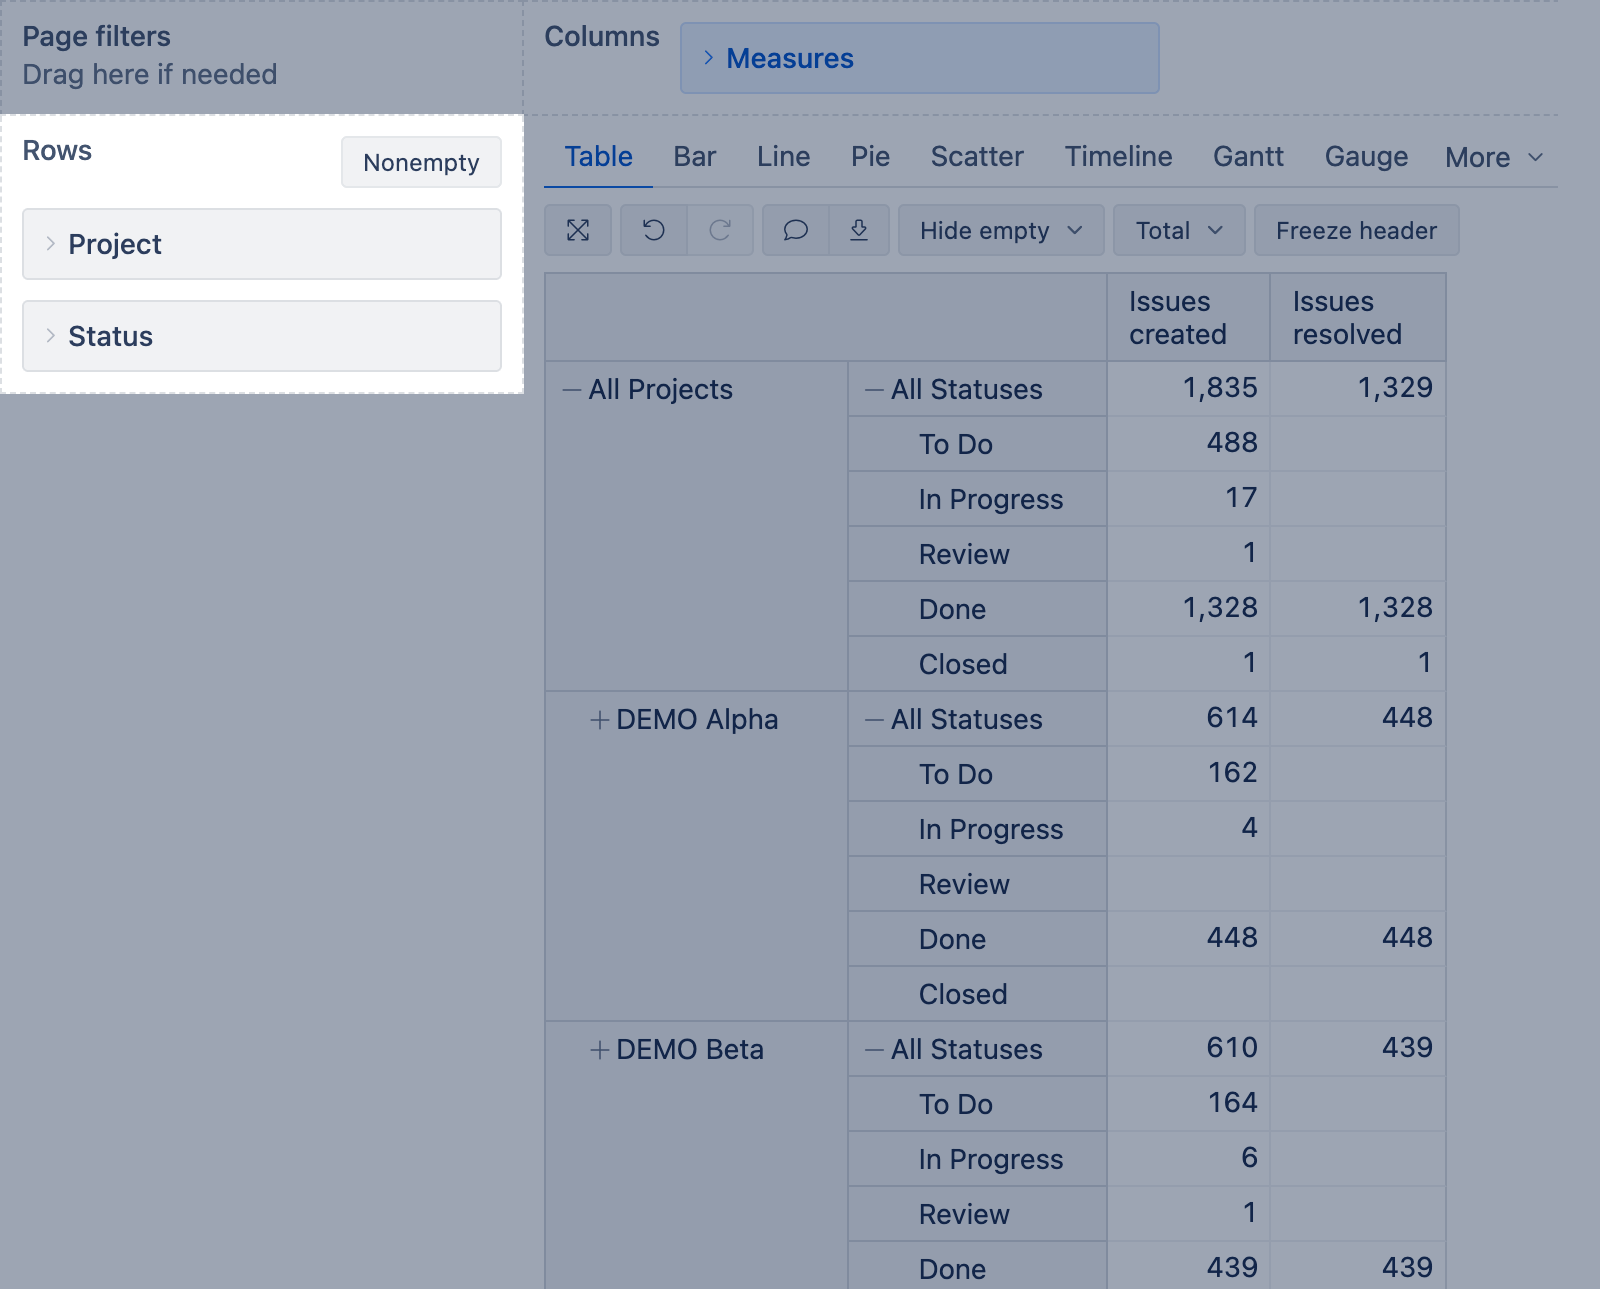
2. Use particular level members in rows and avoid expanded All level members; it is because of performance.
- Avoid Remove option if the report might be shared with other accounts: a name of each particular removed member is saved in the report definition and could behave unexpectedly when imported; also, you won't see from the report itself why you do not see some members. Use filtering instead.

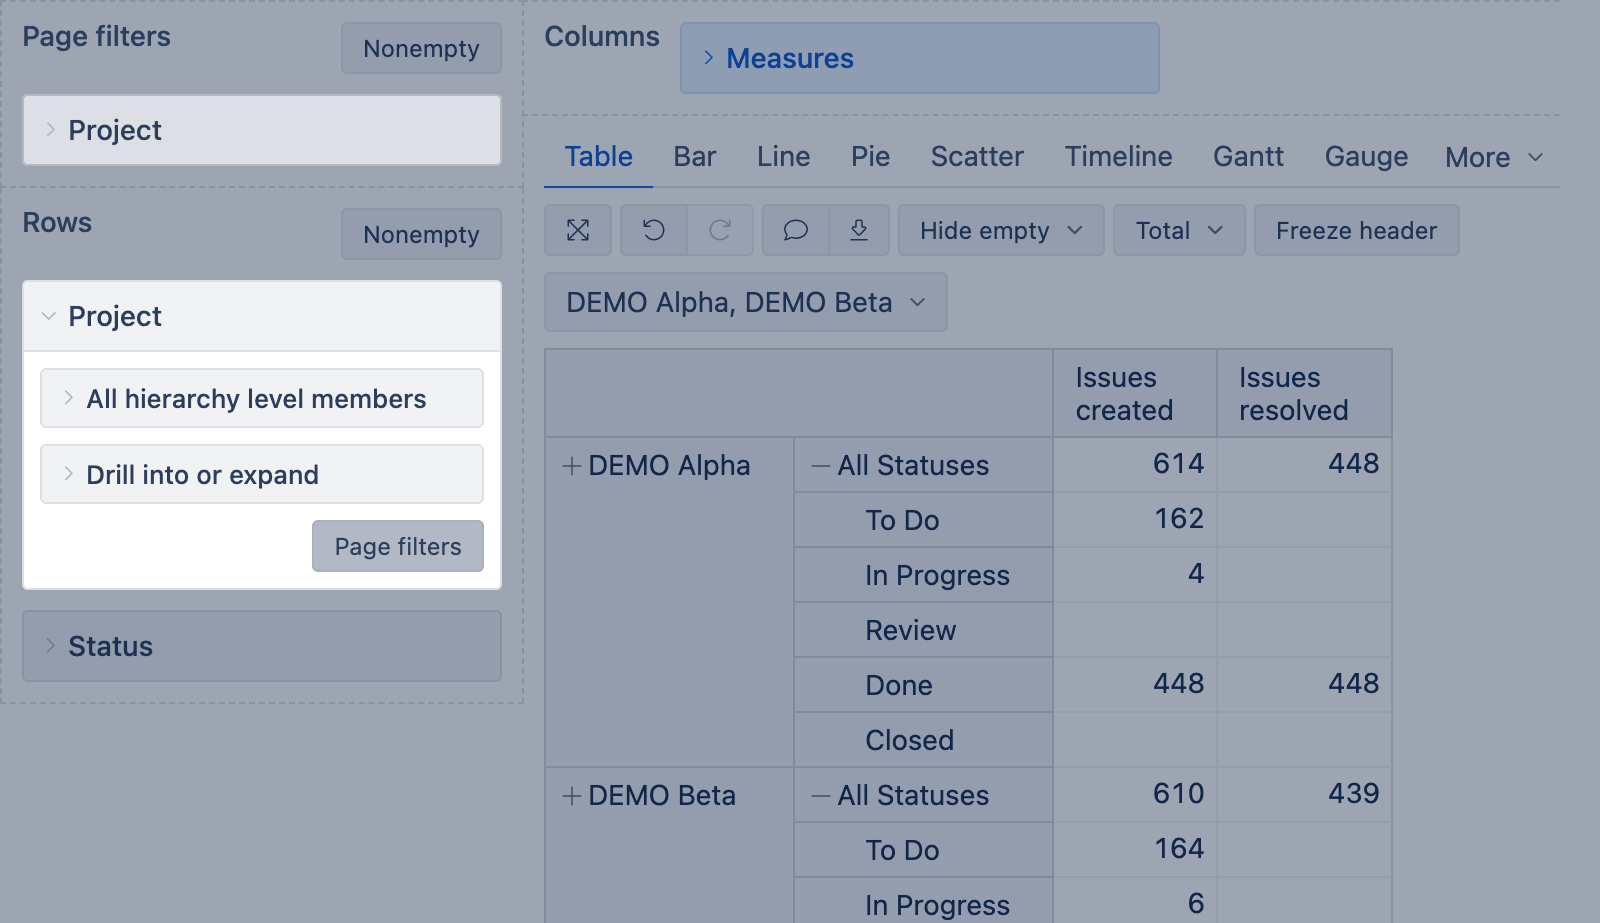
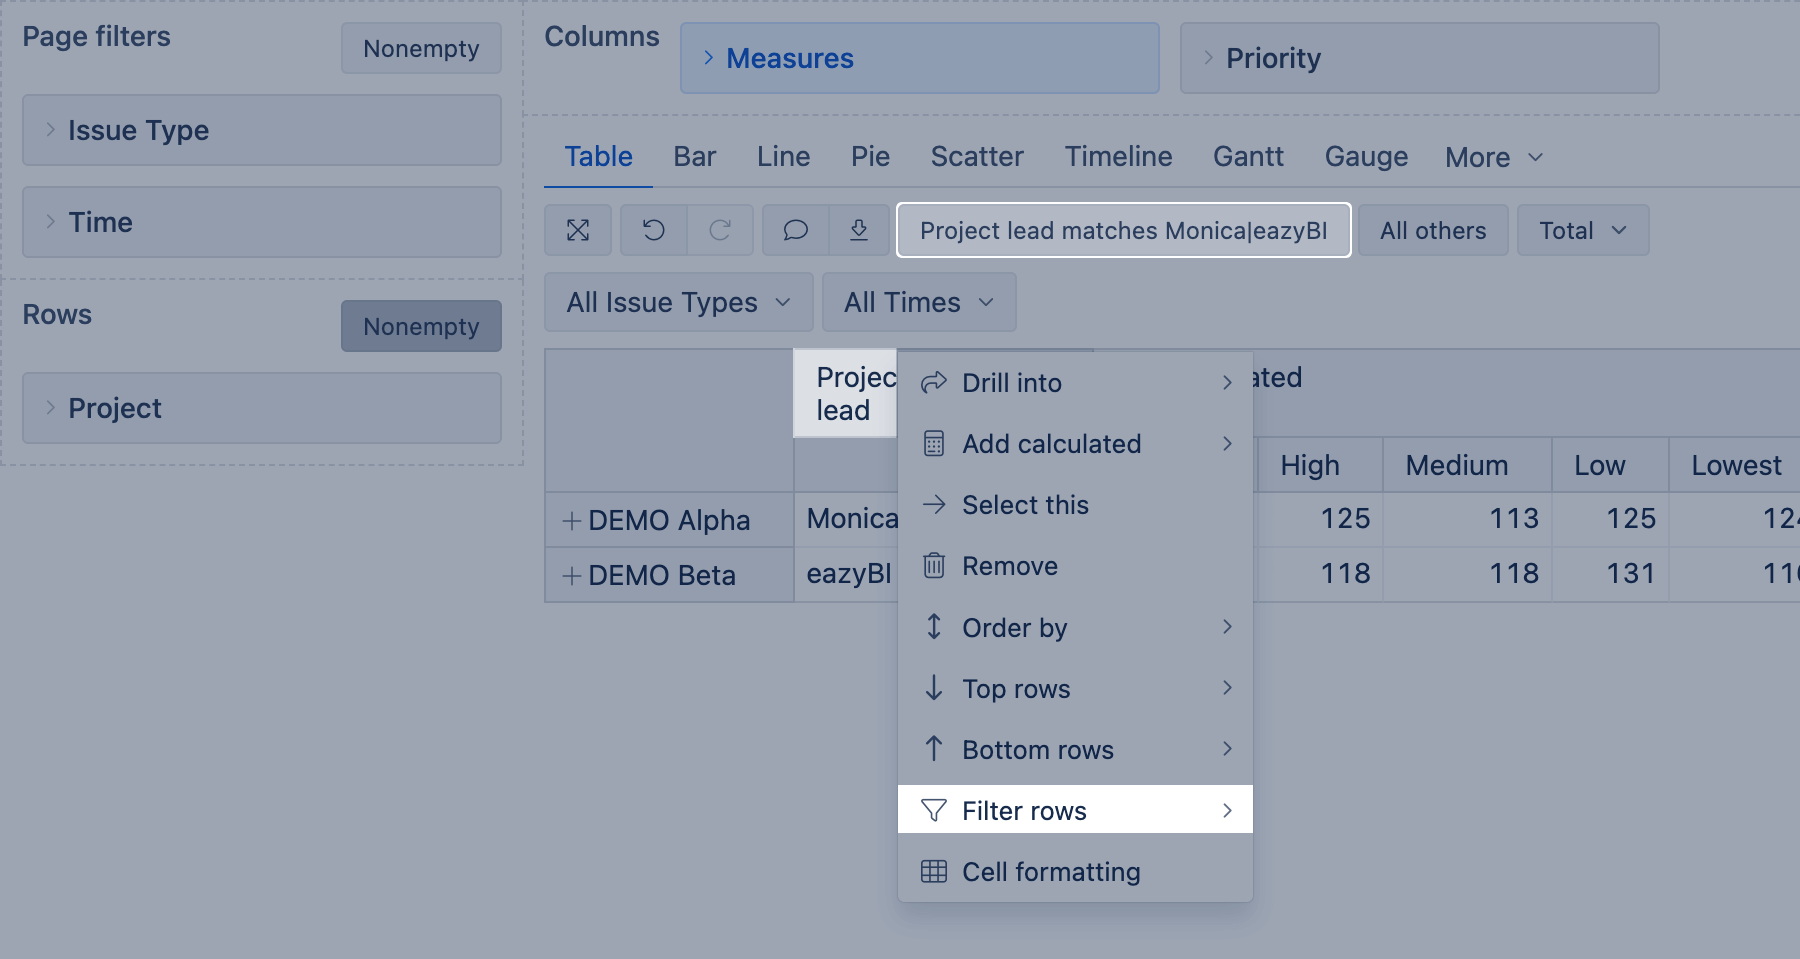
3. If more than one dimension is selected in rows, avoid using calculated members. Use the same dimension as a Page filter instead.
- Some dimensions contain the same data, for example, Project level in Issue, Fix version, Affects version dimensions contain all the projects as Project dimension; use, in Page filters, Project level of the same dimension as in Rows instead of Project dimension
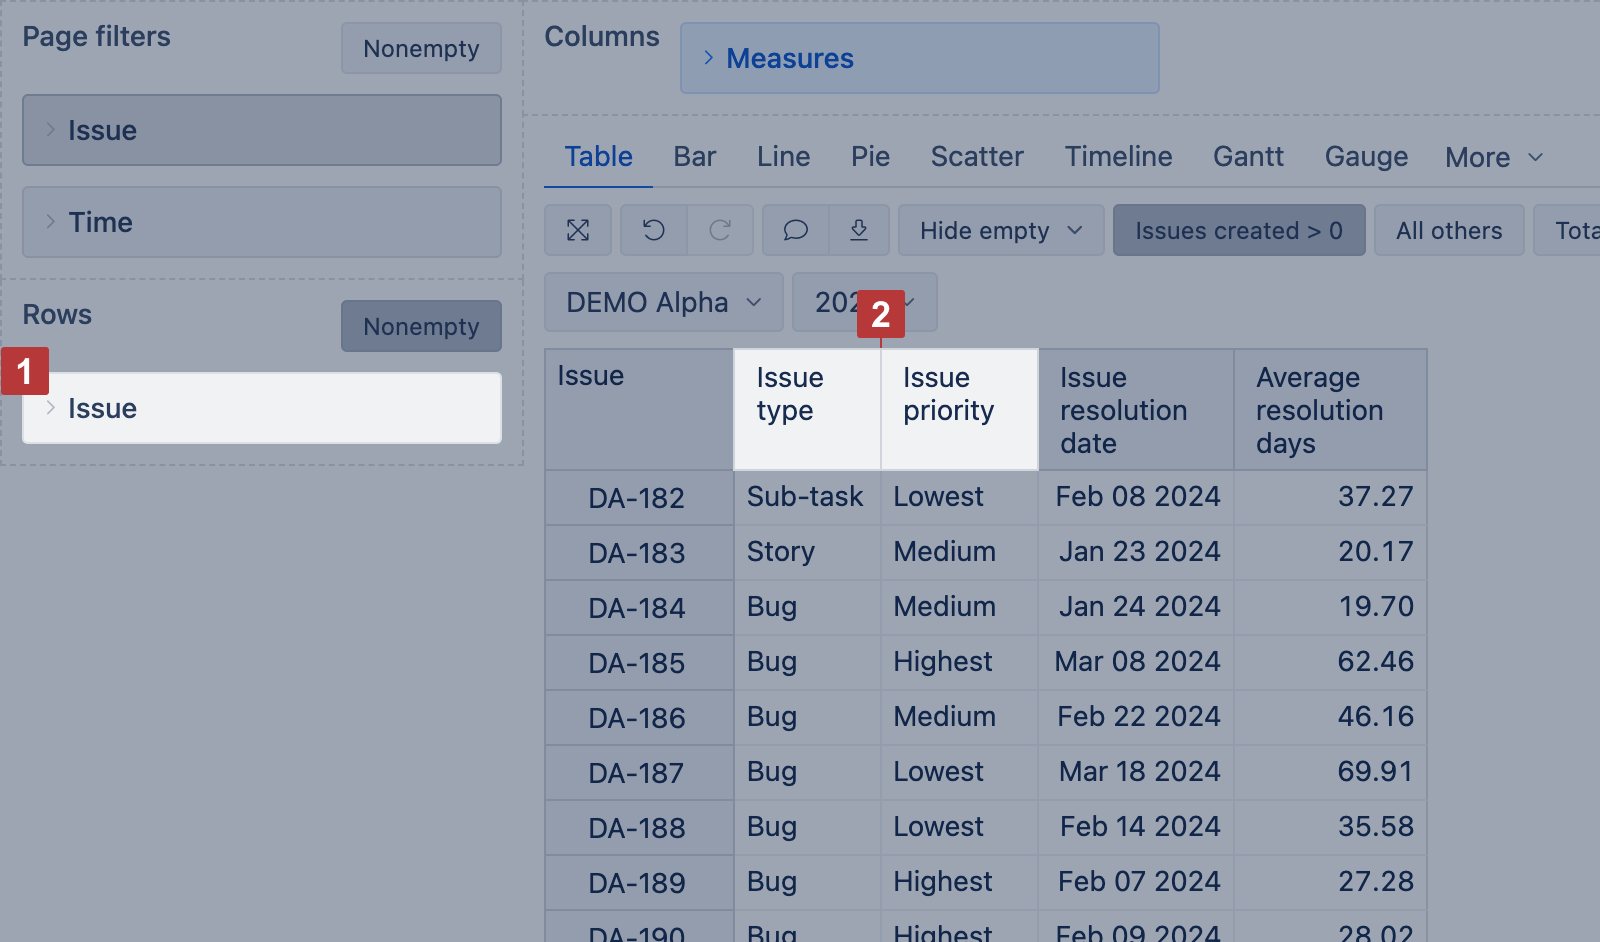
4. If Issue dimension [1] is used in the report rows (data from Jira):
- Avoid using calculated members in this dimension.
- Instead of adding other dimensions to show issue type, assignee, fix version, etc., use Issue properties [2] in columns.
- Do not use All Issues member in rows to create an opportunity for report users to see report data on issue level: let them use Drill into Issues or Drill through issues options.
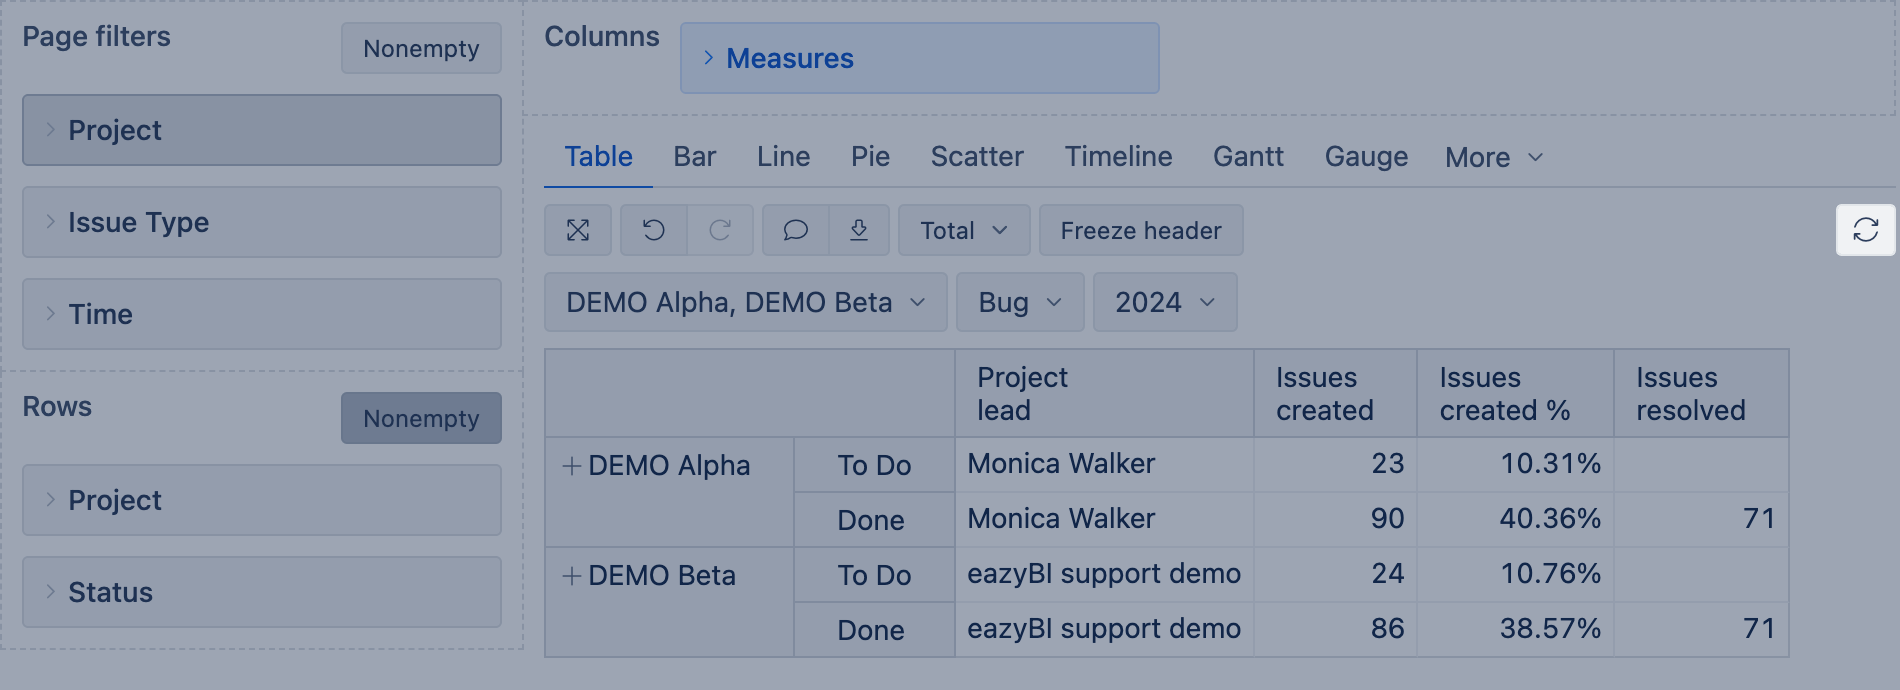
5. Enable the Nonempty option with large dimensions on rows or several large dimensions on rows. The Nonempty option works best when you can significantly reduce the number of rows. For example, in an account with many projects and sprints imported, you can significantly reduce the number of sprints on rows based on project selection.
![]()
6. Use Page filters to scope your report by one or more dimensions [2], selecting one or several [1] members from each. Just keep in mind that each measure is recalculated once per combination of selected members across all Page filter dimensions (e.g., 4×4×4 = 64 combinations), so very extensive multi-dimension selections may affect performance.
- Selection of a calculated member in Page filters with aggregated members is also a multiple-page selection; the same applies to calculated members with Except(), since iterating through all members, except some, is required.
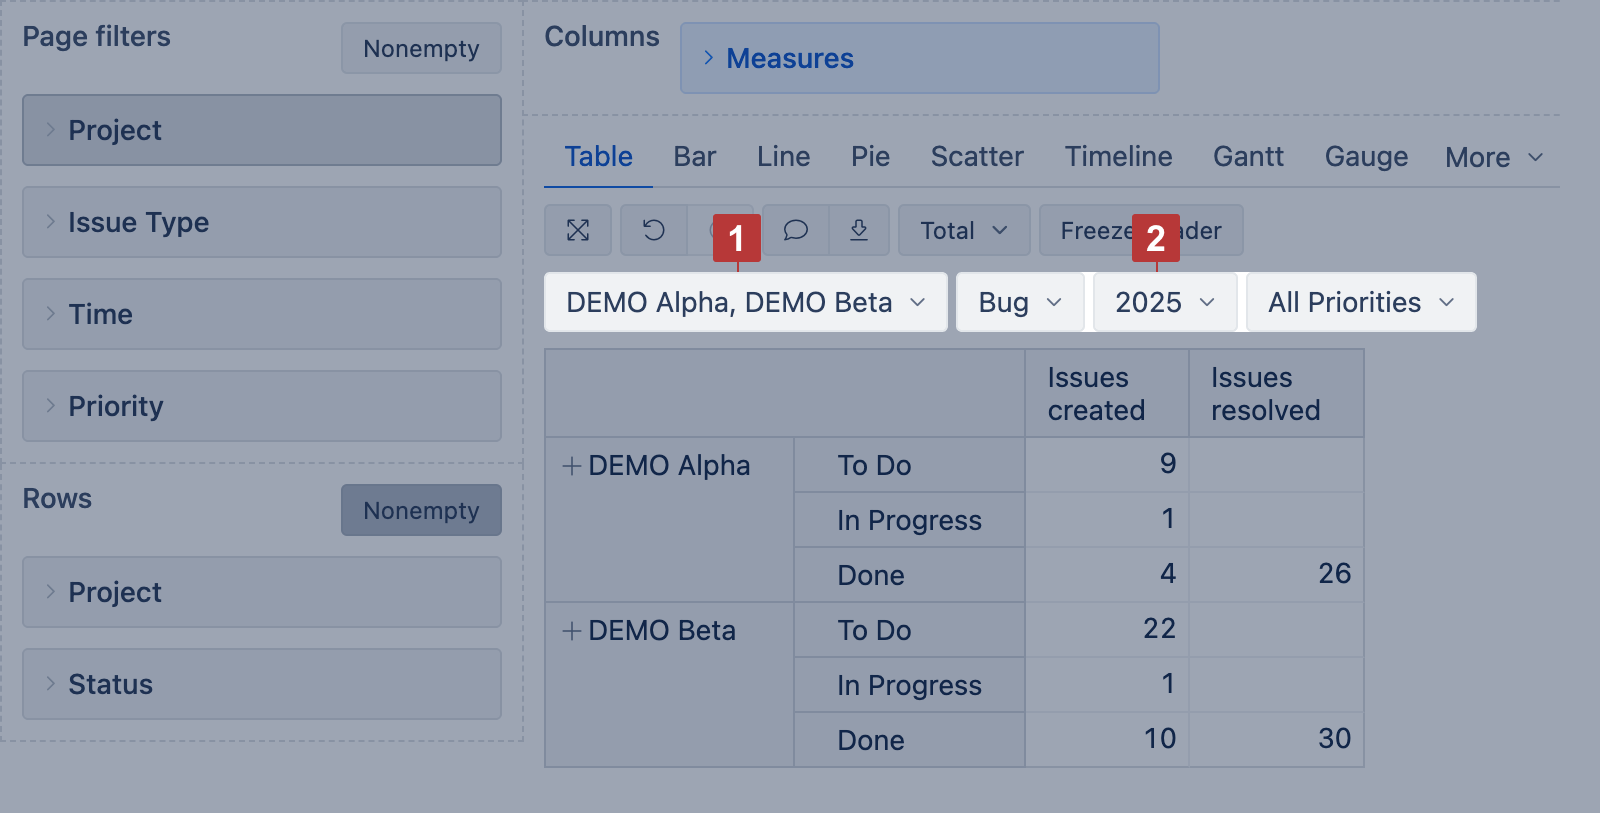
7. Add Measures in Columns [1]. You may also add them to Page filters or Rows. The arithmetical result won't change, but:
- Measures in Page filters are executed more slowly
- Option Drill into dimension [2] works only for Measures in Columns
- Standard calculations using the option Add calculation [3] work only for Measures in Columns
- Row filter by a measure works only for Measures in Columns
8. Whenever possible, use default options for additional data analysis:
- Use option Drill into dimension [2] if only one measure, not all, should be split by another dimension
- Use option Add calculation (trend, cumulative, comparison by time periods, etc.) [3] instead of custom calculated measure as they are optimized; though, some of the statistical calculations (avg, min, max) still could be slow.
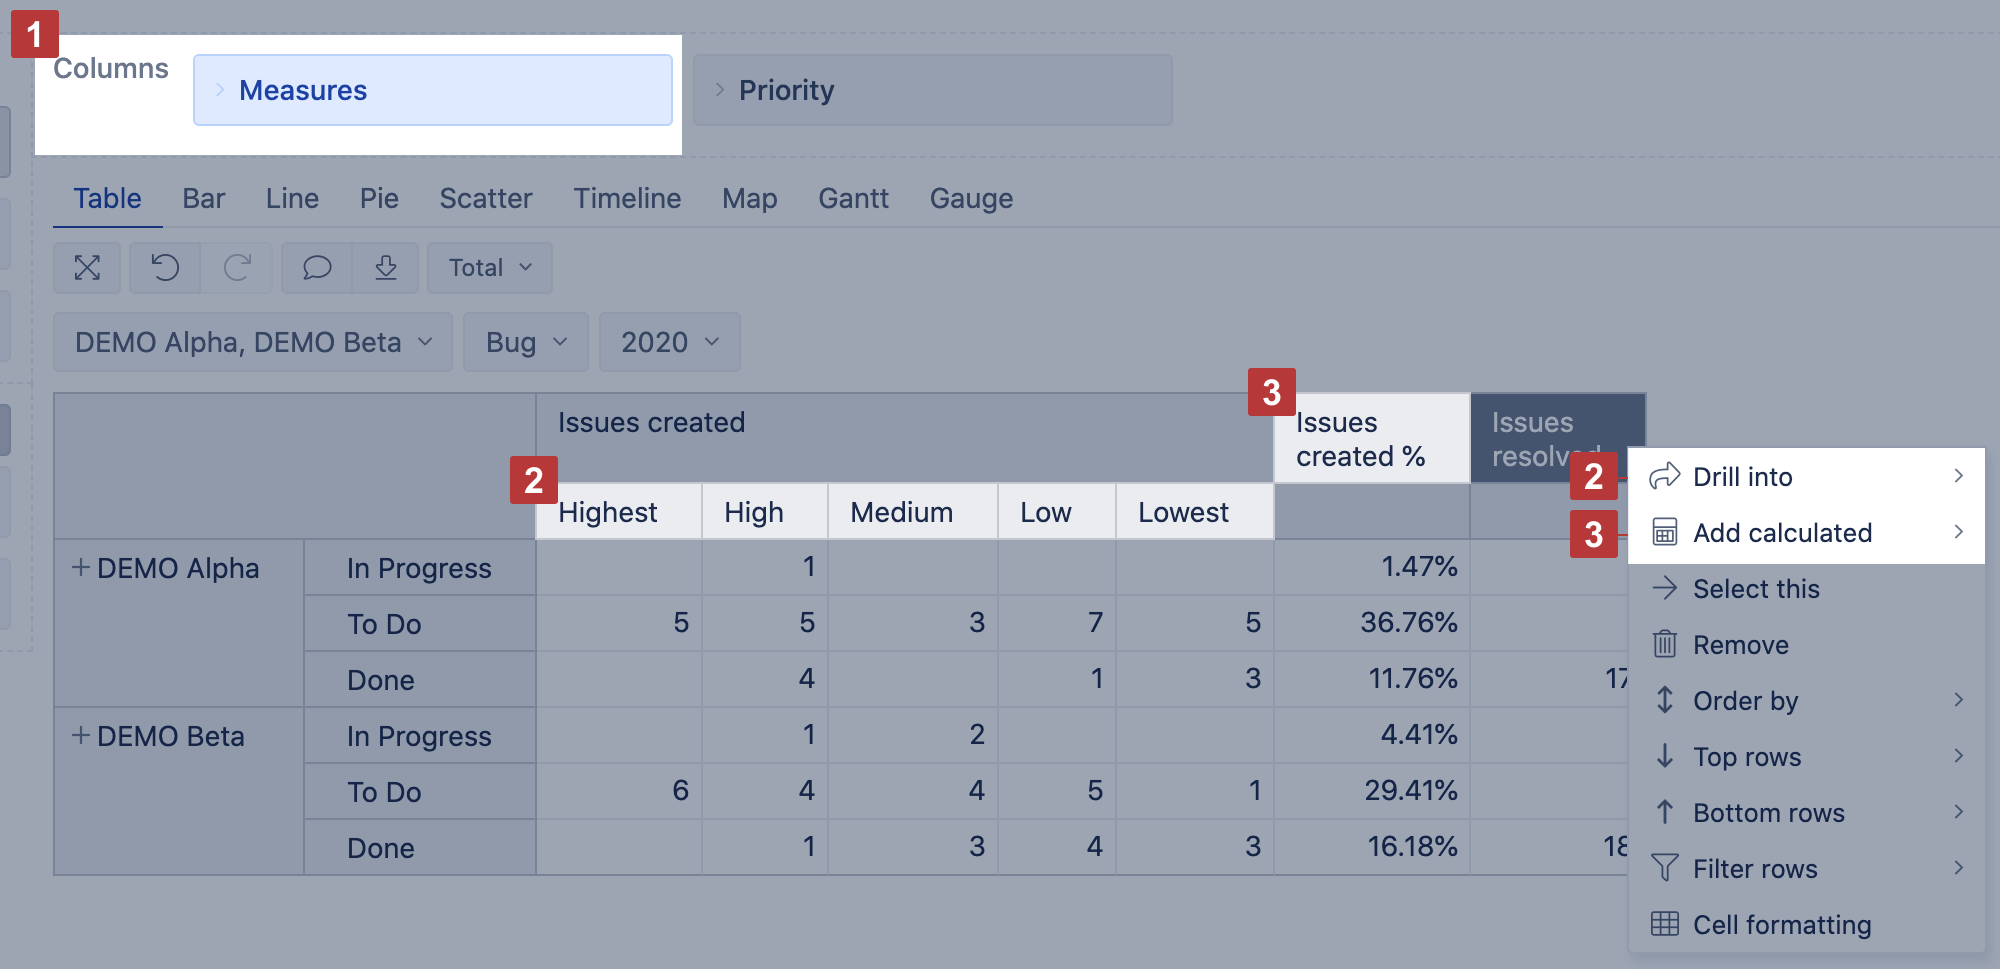
9. Filter rows by simple measures (Issues created, Issues resolved) and properties.
10. While building a complex report, disable the "Auto refresh" option to avoid refreshing the report after each change.
You may want to watch a training video on how those suggestions are used in different reports: Smart Reports without MDX.
Report execution sequence
It is clear that all recommendations can't be applied in all cases. To better understand the steps described in the previous section and how to balance out business needs with technical recommendations and limitations, the following are the sequence of back-end actions and how each report is executed. Based on them it would be easier to figure out how to build a more complex report or what would help to optimize a particular report.
Each of the following steps is executed on the data set that is fetched during the previous step (each step narrows down the data).
- Retrieving report Rows accordingly to the Page selection
- if two or more dimensions are used in the report, then all combinations of all dimension members are retrieved
- when nonempty option is selected, then only rows (members or their combinations) having any measure, according to the Page selection, are retrieved. However, the nonempty option itself could work slow. You would like to use it only to significantly reduce the number of rows based on Page filters selection. eazyBI enables nonempty only for the dimension Issue on Rows by default.
- Filtering rows by FIlter rows (set on columns)
- filters by properties or default measures (like Issues created, Issues resolved, etc) are faster.
- Calculating values for all measures in the report
- any measure is calculated as many times per each cell as many member combinations are selected in Page filters (for example, if there are 3 dimensions in Page filters, and 3 members are selected in each of them, then each measure in each cell is executed 3x3x3=27 times)
- a custom calculation that works in a small account and simple report (single Page selection, one dimension in rows) could time out in a more complex report with more data.
- Applying Hide empty option, to hide rows/columns without values.
To analyze the report's performance, use the Report Optimizer assistant, available on Cloud and since eazyBI version 8.2.
Conclusion
There are limitations on how far you can optimize the report using standard options. If this is not enough, think about precalculating values or importing fewer data into the account. Watch the video Behind complex filters and Managing eazyBI accounts.
Some guidelines on report creation and working on slow reports are discussed in the training video Help my reports are too slow.
If you need some help to see if there is room for improvement in the reports reach out to support@eazybi.com and share the report definition.