
Deployment Frequency
eazyBI for Jira
On this page:
Overview
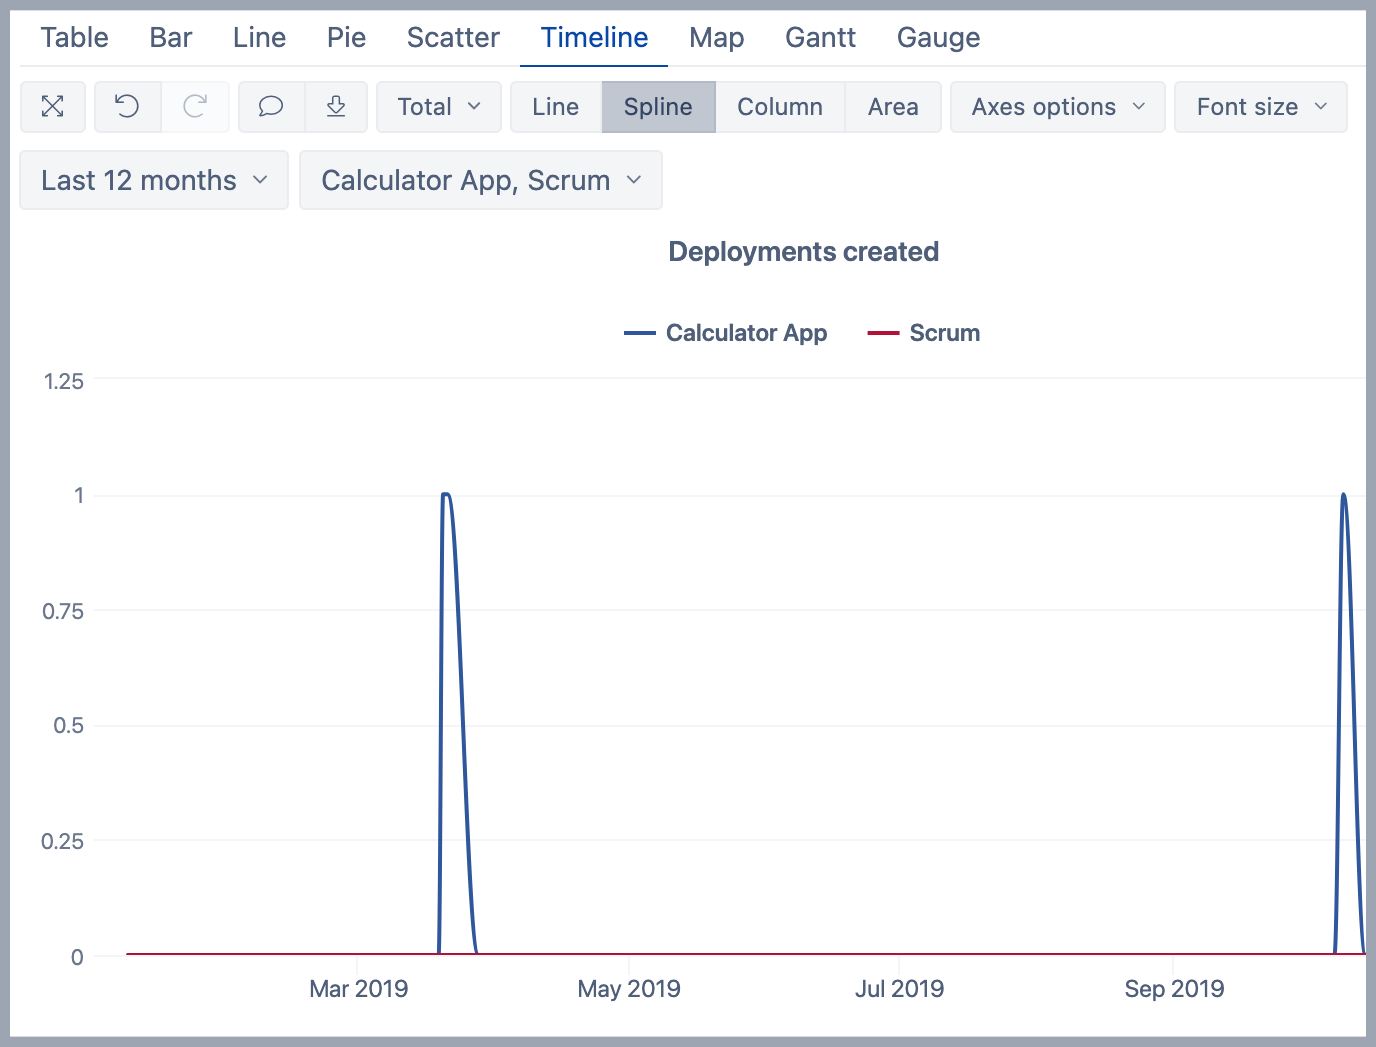
The report shows deployment frequency over time.
How to build it
To build this report, start with the table view and select the Time dimension in Rows. Then in the Measures dimension, select measure Deployments created and unselect default measure "Issues created".
Measure Deployments created counts how many deployments are for builds related to the issues. To have a continuous line use standard calculation "Empty as 0" for "Deployment created" and create a new measure "Deployment created (empty as 0)". As eazyBI doesn't allow having the same name used for another measure, then use a little trick with an empty space and rename the calculated measure to "Deployment created " using the option "Edit calculated". Remove measure "Deployment created".
Configure the Time dimension as it is more comfortable, e.g. "Day" to see how many deployments were at each day. Add "Time" dimension to Pages. Select member Last 12 months and apply this member in Page filter.
Drag and drop the Project dimension into columns and select the "Project" level to see data per each project. Add "Project" dimension also into Pages and select projects that have related DevOps metrics. When eazyBI creates sample reports then the top 3 projects are automatically selected.
Switch to the Timeline tab and select the Spline option.
See also
- Learn about different DevOps measures and hidden dimensions - what they are and how they work.
- See more about options that are available when you create a report.
- Learn how to modify different chart types.
- See training videos to learn more.