
Release overview
eazyBI for Jira
On this page:
Overview
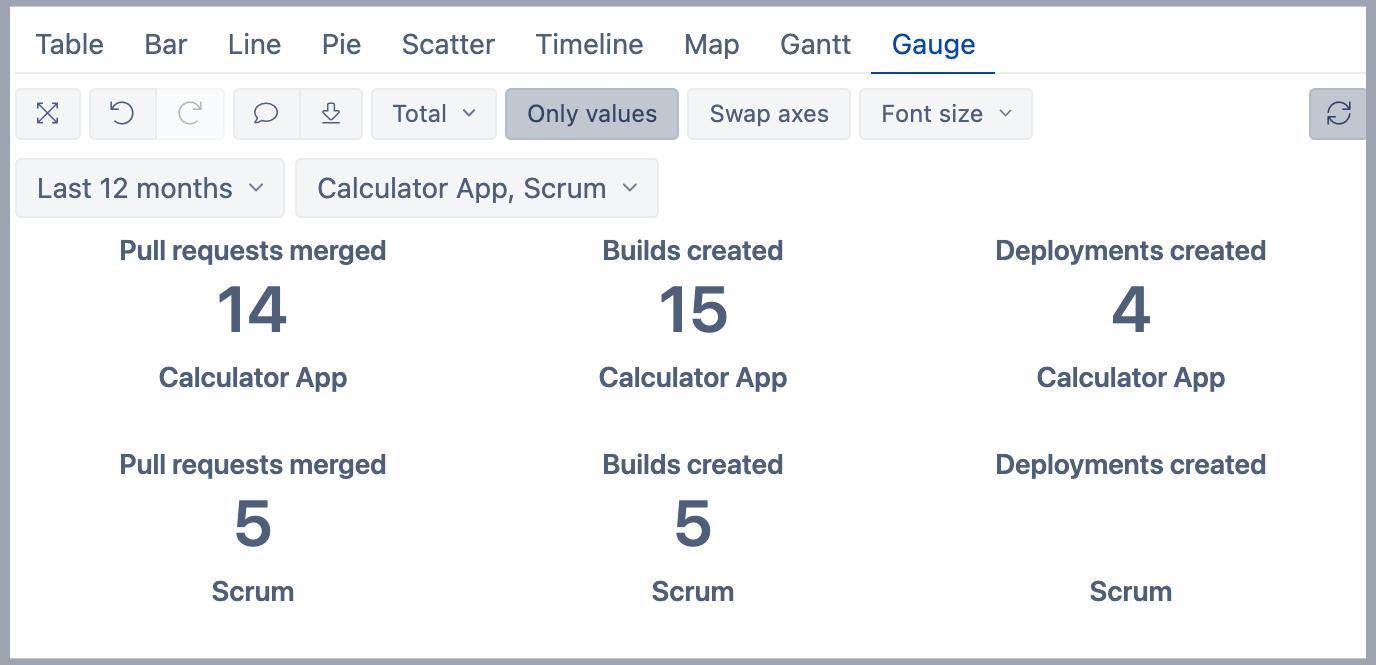
The report shows how many pull requests, builds created and deployment created are per each project.
How to build it
To build this report start with the table view and drag and drop Project dimension in Rows, select the "Project" level to see data per each project. Add "Project" dimension into Pages and select projects that have related DevOps metrics. When eazyBI creates sample reports then the top 3 projects are automatically selected.
Then in the Measures dimension select measure Pull requests merged, Builds created and Deployments created and unselect default measure "Issues created".
- "Pull requests merged" - pull requests merged count. eazyBI imports only those pull requests that have an issue key linked to them (either in the title, comment, or in the commit message). In this way, eazyBI can display the pull requests on the issue level.
- "Builds created" - how many builds are for commits related to the issue.
- "Deployments created" - counts how many deployments are for builds related to the issue.
Add Time dimension to Pages. Select member Last 12 months and apply this member in Page filter.
Switch to the Gauge tab and in the toolbar select option Only values.
See also
- Learn about different DevOps measures and hidden dimensions - what they are and how they work.
- See more about options that are available when you create a report.
- Learn how to modify different chart types.
- See training videos to learn more.