Data from YouTrack
eazyBI.com
YouTrack is a project management tool packed with features that streamline your work and increase productivity on any team project. From software development and DevOps to HR and marketing, all kinds of teams can easily use YouTrack’s functionality to track and collaborate on projects of any size.
eazyBI extends YouTrack reporting with advanced, easy-to-use, and flexible visualization, analysis, and reporting. You can create an eazyBI account and perform your first import in minutes. Regular daily updates import data automatically, ensuring your charts always reflect the latest data. eazyBI offers several predefined sample reports, charts, and a dashboard to help you get started. You can easily create custom reports, charts, and dashboards for your specific needs.
On this page:
Additional information:
Initial Import
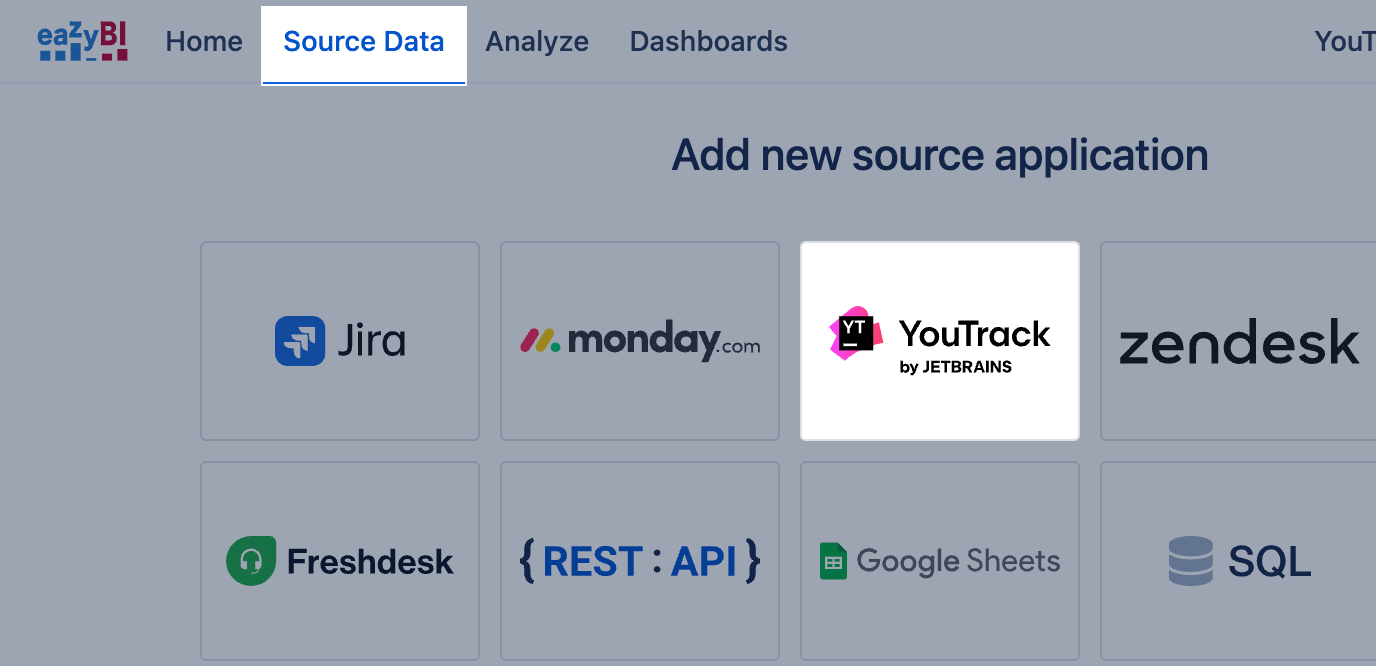
After creating an eazyBI account, it's time to import the data from YouTrack. From the Source Data tab in Source Applications, select Add new source application, and select YouTrack.
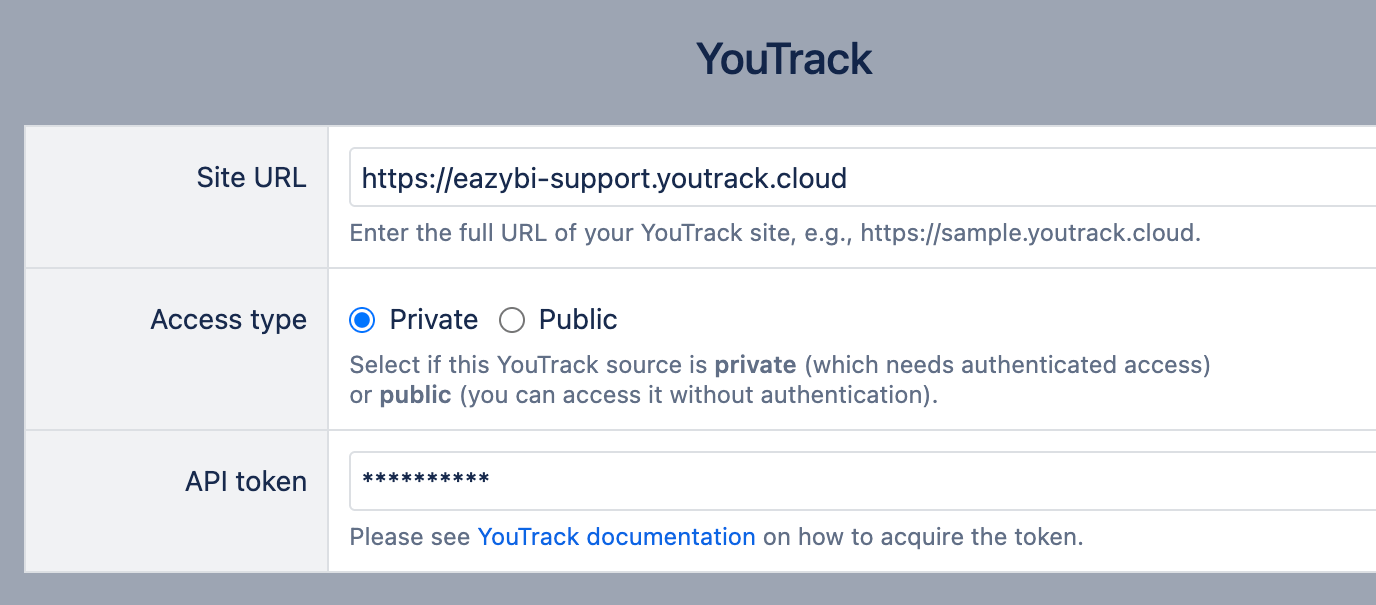
You will need to provide the site URL and Access type. If the Access Type is Private, provide an API token.
Select YouTrack Import options
Select which YouTrack projects you would like to import into eazyBI. You can select all or individual projects, hide unselected ones, and clear selection [1] . Use the search filter to find your project [2] .
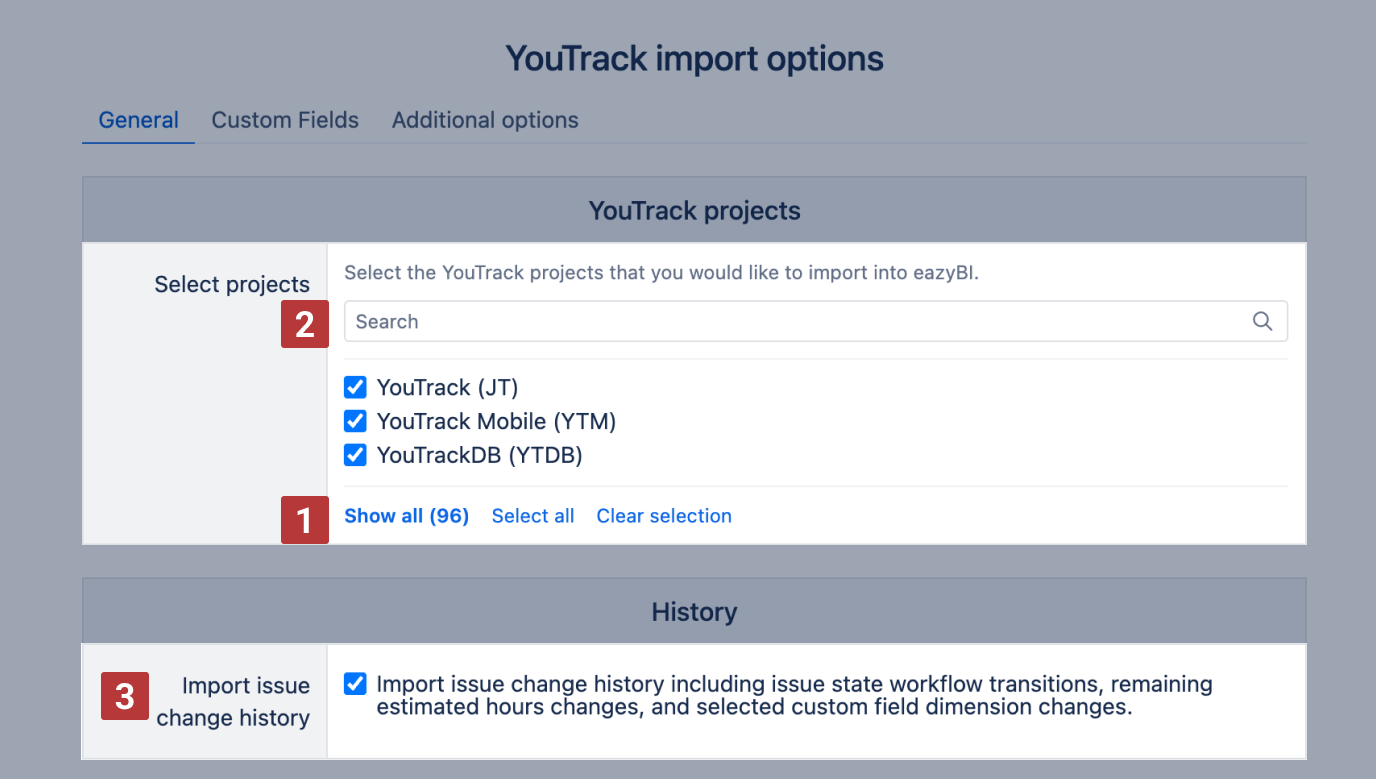
Please select Import issue change history [3] to analyze issue change history, including:
- issue state/stage workflow transitions – how many times issues are transitioned to a particular workflow state/stage,
- how custom field measures or single-value custom dimensions were changed over time.
With this option selected, change history is enabled for all state type dimensions - State, Stage, etc.
During data import, eazyBI automatically imports data from YouTrack standard fields like Issue, Tag, State, Reporter, and others.
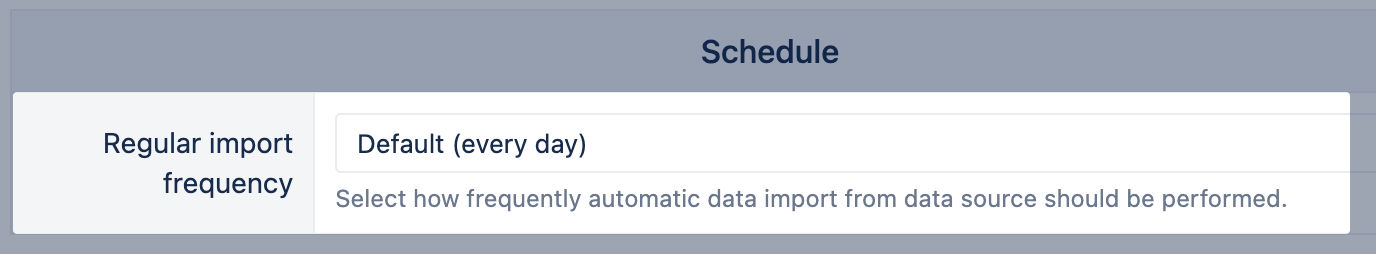
Regular import frequency
Specify a schedule of how frequently you would like to perform the YouTrack data import into eazyBI. Automatic imports will process created and updated issues since the last import.
Custom Field data import
If you want to import YouTrack custom fields, go to the Custom fields tab and select the custom fields you want to import and analyze. The list of available custom fields is based on the selected project.
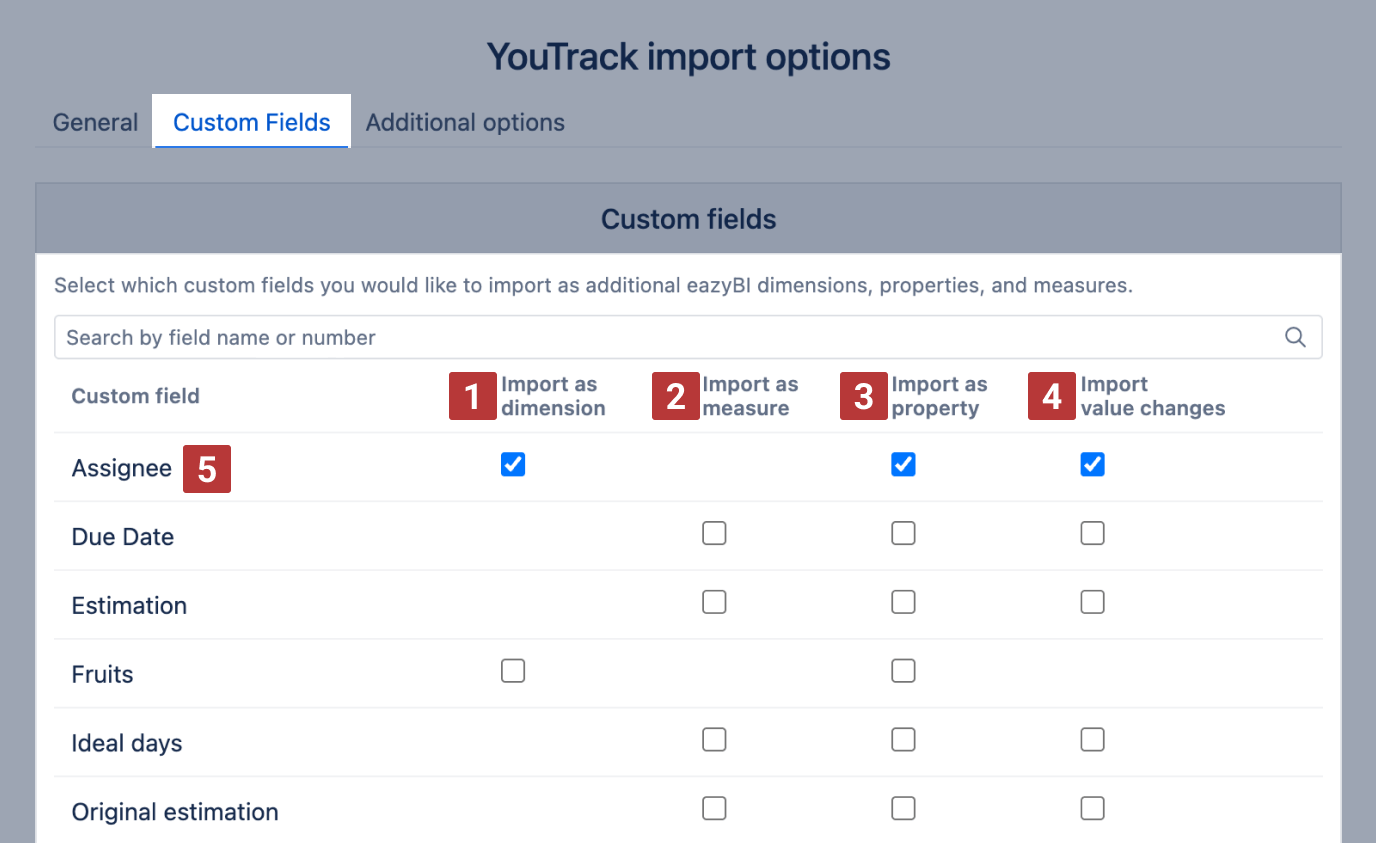
Custom fields can be imported as dimensions [1] , measures [2] , properties [3] , or value change history [4] . Click on a custom field name [5] to select all available checkboxes for this field.
The available import options depend on the type of custom field.
- Select Import as dimension if you want to analyze total numbers or group results by the custom field values.
- If the custom field is specific to each issue and you just want to get this information when looking at a particular issue, import it as a property.
- If you want to get totals for a numeric or date field, import as a measure. The result will be a set of measures with totals of custom field numeric values or measures with custom date fields.
- If you want to see how custom field values are changed over time, then import value changes.
Standard custom field types
Integer and float type custom fields can be imported as measures and properties. Measures will be named "<FIELD NAME> created", "<FIELD NAME> resolved", etc., and represented on a timeline based on relevant issue dates, like issue creation, resolution, etc. dates.
Date, date and time type custom fields can be imported as measures. Measures will have names ending in "... with <FIELD NAME>" and count issues or values on the timeline tied to the date. For example, a start date custom field for issues will be imported as "Issues with start date". The corresponding property will be located in "Issue properties" and named "Issue Start Date". If there are also integer or float custom fields imported as measures, like "Amount", then the measure "Amount with start date" will return the total amount of issues by their start date on the Time dimension.
Enum, group, user, ownedField, version,and build columns can be imported as dimensions. Dimensions can be used in reports to filter data in page filters or split data. For example, if you have an enum selection custom field named "Label", you can import it as a dimension. You can create reports using the Label dimension in rows or as page filters and access the corresponding issues property named "Issue label".
Currently, the following standard custom field types are available for import:
- string - as property,
- text - as property,
- date - both as a property and as a measure, with value changes,
- date and time - both as property and as a measure, with value changes,
- period - both as a property and as a measure, with value changes,
- integer - both as a property and as a measure, with value changes,
- float - both as a property and as a measure, with value changes,
- enum - both as a property and as a dimension, with value changes for single value fields,
- group - both as property and as dimension,
- user - both as property and as dimension, with value changes for single value fields,
- ownedField - both as property and as dimension, with value changes for single value fields,
- state - all state type fields are imported as properties and as dimensions by default, with value changes,
- version - both as property and as dimension,
- build - both as property and as dimension, with value changes for single value fields,
Additional options
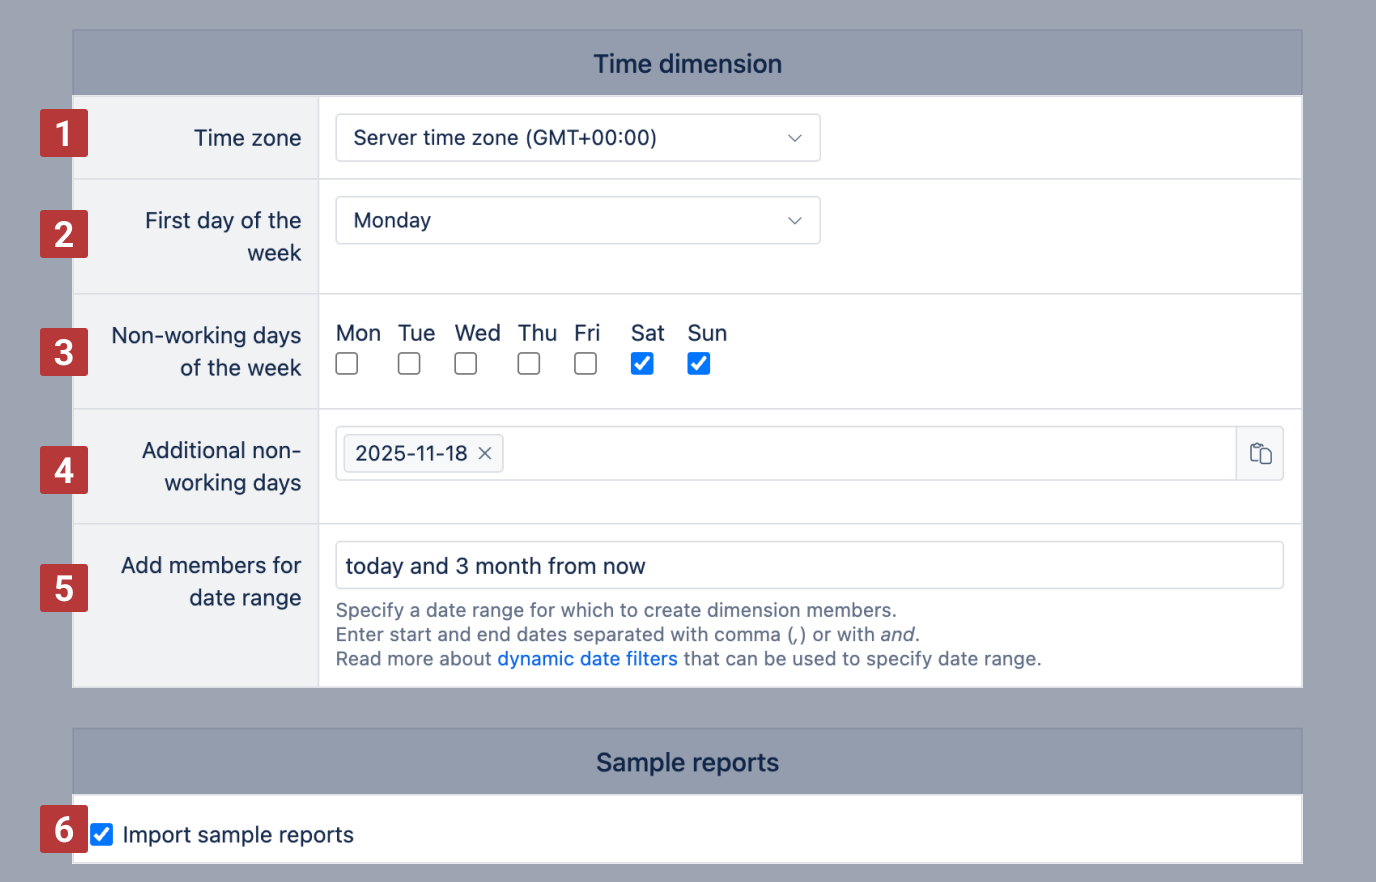
You can specify the time zone [1] , the first day of the week [2] and non-working days [3] [4] of the Time dimension.
You can use only one time zone in each eazyBI account. The time zone of the Time dimension will be used to determine the date member in the Time dimension when importing issue measures (e.g. Issues created, Issues resolved, and others) and issue properties. If a time zone is not specified, then the default Time zone will be used. If a different time zone is selected, then all date timestamps will be converted to this time zone.
The first day of the week [2] is used for the Time dimension Weekly hierarchy and also Week Day dimension.
Non-working days (standard non-working days of the week and additional non-working days/holidays) will be used to calculate the new workdays measures – Average resolution workdays, Average age workdays, Workdays in transition state, Average workdays in transition state. Non-working days of the Time dimension will also be used for DateDiffWorkdays and DateAddWorkdays MDX functions as a default non-working days argument.
If you have a long list of additional non-working days [4] , then you can copy the list and paste in the time dimension options for the different eazyBI accounts.
It is possible to add members for date range [5] in the Time dimension (all hierarchies) to analyze reports not just by time periods where eazyBI finds activity in the project issues but also by future periods which can be useful for forecast and trend analysis. See more on benefits of adding members for a date range.
Select the option Import sample reports [6] to get a set of reports created by eazyBI and have a first look at your data in eazyBI.