YouTrack measures and dimensions
eazyBI.com
On this page:
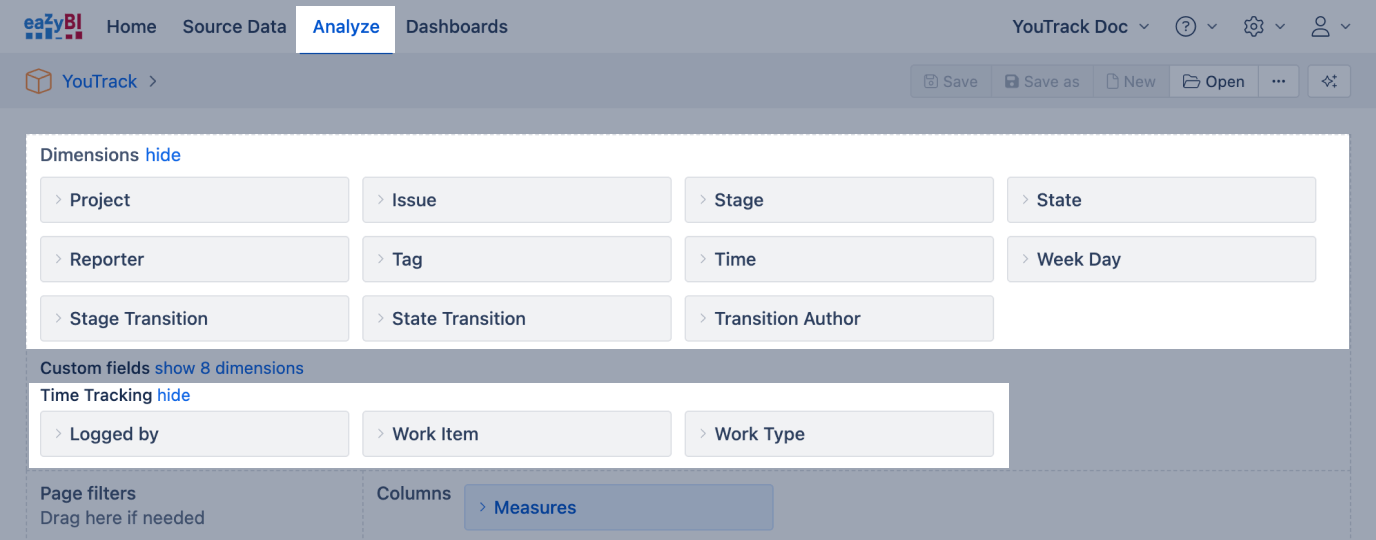
Dimensions
The data cube contains the following predefined dimensions. Also, all state-type fields are imported as dimensions.
Project | Project that the issues belong to.
|
|---|---|
Issue | List of all individual issues, grouped by Project hierarchy level. The Issue dimension is typically not used in summary reports; however, it can be used to drill down into a selected report cell across the Issues dimension at the Issue level to see all individual issues that make up the total. |
<State> | Each <state type> field in YouTrack has its own dimension created. The state of the issue. Returns the current state for total numeric measures. Returns the historic state for historic measures. The primary hierarchy groups states by their name. Issue state name is a combination of the state name and project key, like "In Progress (DEMO)". This dimension has a secondary hierarchy that aggregates members into the State Category. It groups issues by state Category, then by state name, and then by project state. This allows you to analyze all issues with the same state name across all the projects. |
Reporter | Users who reported issues. There is an option to create custom hierarchies with the Add custom hierarchy. It is possible to create a hierarchy based on custom Reporter properties imported with additional data import. Reporter dimension members have several properties available, such as Email and user groups. You can display properties for user-level members using the function Get in a calculated measure. |
Tag | The issue's current tags. If several tags are specified for an issue, then measures will be counted for each tag. |
Time | Standard time dimension with Year / Quarter / Month / Day hierarchy and weekly hierarchy with Year / Week / Day levels. There is an option to create custom hierarchies with the Add custom hierarchy. It is possible to create a Fiscal hierarchy and Multiple weeks hierarchies. |
Week Day | Days of the week. The order of the days is depending on the import settings about the first day of the week. |
If the Issue change history is imported, the following dimensions are created:
<State> Transition | All individual transitions with names in the format “From state => To state”. Each <state type> field in YouTrack has the historical transition dimension created, named <State type field name> Transition. |
|---|---|
Transition Author | The user who performed the transition. |
Transition Field | A hidden dimension that could be used in the calculated measures to limit changes to a particular dimension only. |
The following dimensions are created under the "Time Tracking" section:
Logged by | Users who have logged hours. This is to be used with the Hours spent measure. There is an option to create custom hierarchies with the Add custom hierarchy. User dimension members have several properties available: Email, Groups, and Teams. You can display properties for user-level members using the function Get in a calculated measure. |
|---|---|
Work Item | This dimension can be used with the measures "Hours spent" to analyze results by different Time periods, Logged by users, and/or "Issues". Dimension members will be Work Item IDs. |
Work type | Work Item category. |
Measures
Data cube contains the following predefined measures:
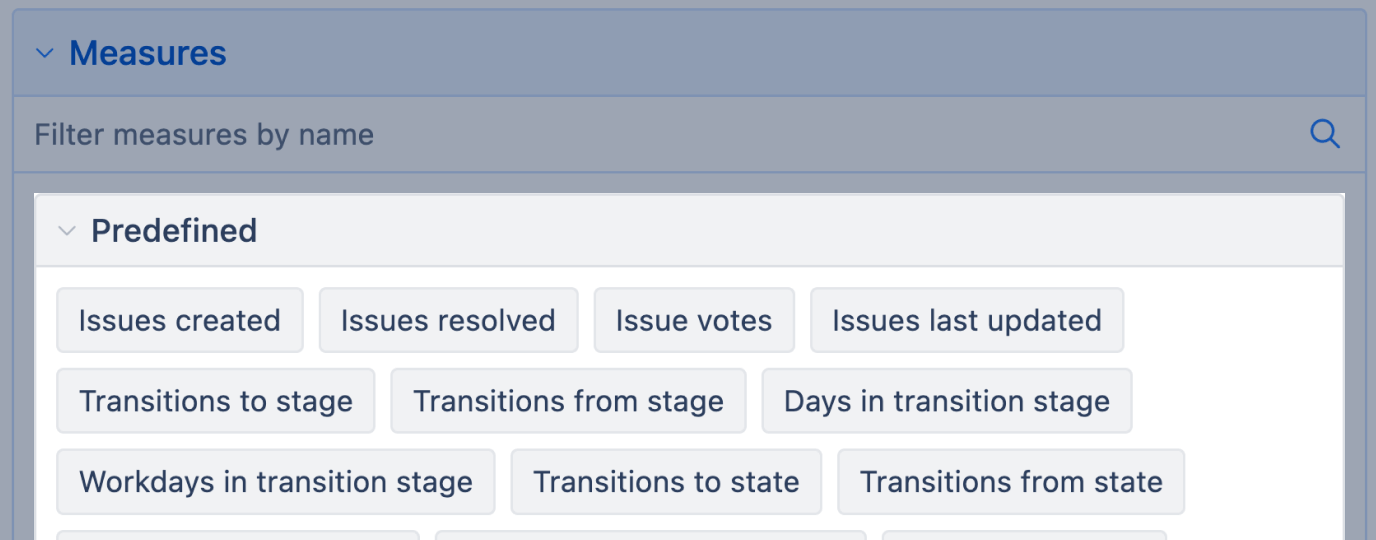
Issues created | The total number of created issues that match selected dimension members. If the Time dimension is used, issues created are grouped by issue creation dates. |
|---|---|
Issues resolved | Resolved issues that have a resolution date. Used with the Time dimension, grouped by issue resolution dates. |
Issue votes | A count of how many users have voted for an issue. |
Issues last updated | A total number of issues that match selected dimension members. If the Time dimension is used then Issues last updated counts issues by the last update date and shows the total count in the corresponding period. |
Transitions to <State> | How many times during selected Time dimension period issue has been transitioned to the state that is selected in <State> dimension (or only transitions that are selected in <State> Transition dimension). Also, first issue state will be counted in this measure on issue creation date. If you would like to see a distinct (unique) count of issues for these transitions then use Transitions to <State> issues count measure from the Distinct issues count measure group. |
Transitions from <State> | How many times during selected Time dimension period issue has been transitioned from the state that is selected in <State> dimension to different state (or only transitions that are selected in <State> Transition dimension). If you would like to see a distinct (unique) count of issues for these transitions then use Transitions from <State> issues count measure from the Distinct issues count measure group. |
Transitions to | Hidden measure How many times during selected Time dimension period issue has changes to some value in any <State> or any custom field with enabled value changes If you would like to see a distinct (unique) count of issues for these transitions then use Transitions to issues count measure (hidden measure). You could use Transition Field dimension (it is a hidden dimension and could be used only in calculated measures) to limit transitions for a particular dimension only. |
Transitions from | Hidden measure How many times during selected Time dimension period issue has changes from some value in any <State> or any custom field with enabled value changes If you would like to see a distinct (unique) count of issues for these transitions then use Transitions from issues count measure (hidden measure). You could use Transition field dimension (it is a hidden dimension and could be used only in calculated measures) to limit transitions for a particular dimension only. |
Transition to first timestamp | Hidden measure Shows the timestamp of the first transition to some value in any <State> or any custom field with enabled value changes. You could use Transition field dimension (it is a hidden dimension and could be used only in calculated measures) to limit transitions for a particular dimension only. |
Transition to last timestamp | Hidden measure Shows the timestamp of the last transition to some value in any <State> or any custom field with enabled value changes. You could use Transition field dimension (it is a hidden dimension and could be used only in calculated measures) to limit transitions for a particular dimension only. |
Transition from first timestamp | Hidden measure Shows the timestamp of the first transition from some value in any <State> or any custom field with enabled value changes. You could use Transition field dimension (it is a hidden dimension and could be used only in calculated measures) to limit transitions for a particular dimension only. |
Transition from last timestamp | Hidden measure Shows the timestamp of the last transition from some value in any <State> or any custom field with enabled value changes. You could use Transition field dimension (it is a hidden dimension and could be used only in calculated measures) to limit transitions for a particular dimension only. |
Days in transition <State> | Use this measure for individual issues to show how many days issue has stayed in <State> field from <State> dimension. It is calculated when an issue is transitioned from this state (when the Transitions from <State> measure is recorded) and will be shown on Time dimension on the date when the transition from this state happened. Use Average days in transition <State> calculated measure when you are analyzing totals of many issues. |
Workdays in transition <State> | Similar to Days in transition <State> but only workdays are calculated according to Time dimension options. |
Days in transition | Counts days between activities in issue. Use this measure for individual issues and any dimension with change history import to see how long issue was with a particular value. |
Workdays in transition | Similar to Days in transition but only workdays are calculated according to Time dimension options. |
Open Issues | Calculates a number of unresolved issues at the end of the corresponding Time dimension period (as Issues created minus Issues resolved since the beginning of the time until the end of the selected time period). |
Average resolution days | Calculates the average resolution days of resolved issues (counted as Issues resolved) and groups them by issue resolution date on the Time dimension. Total resolution days hidden measure, which returns a pre-calculated number of days from created to resolved dates, is used in the Average resolution days formula. |
Average resolution workdays | Similar to Average resolution days but only workdays are calculated according to Time dimension options. |
Average age days | Calculates the current average age days of unresolved issues. |
Average age workdays | Calculates the current average age workdays of unresolved issues. |
Issues history | Counts issues at the end of the selected Time dimension period
|
Average days in transition <State> | Average days that issue stayed in state that is selected in the particular <State> dimension. It is calculated when an issue is transitioned from this state (when the Transitions from <State> measure is recorded) and will be shown on Time dimension on the date when the transition from this state happened. |
Average workdays in transition <State> | Similar to Average days in transition <State> but only workdays are calculated according to Time dimension options. |
Transition to <State> first date | Shows the date and time when the first transition to the corresponding <State> (or the selected <State> Transition) was performed. |
Transition to <State> last date | Shows the date and time when the last transition to the corresponding <State> (or the selected <State> Transition) was performed. |
Transition from <State> first date | Shows the date and time when the first transition from the corresponding <State> (or the selected <State> Transition) was performed. |
Transition from <State> last date | Shows the date and time when the last transition from the corresponding <State> (or the selected <State> Transition) was performed. |
Distinct issues count measures
The distinct (unique) issues count measure group has the number of unique issues in a selected context. When a multi-value dimension with multiple selected members is used on pages (for example, Label), it produces different results compared to the standard Issues created, Votes, or Resolved measures. This happens because the distinct count ensures each issue is counted only once, even if it appears in several of the selected values.
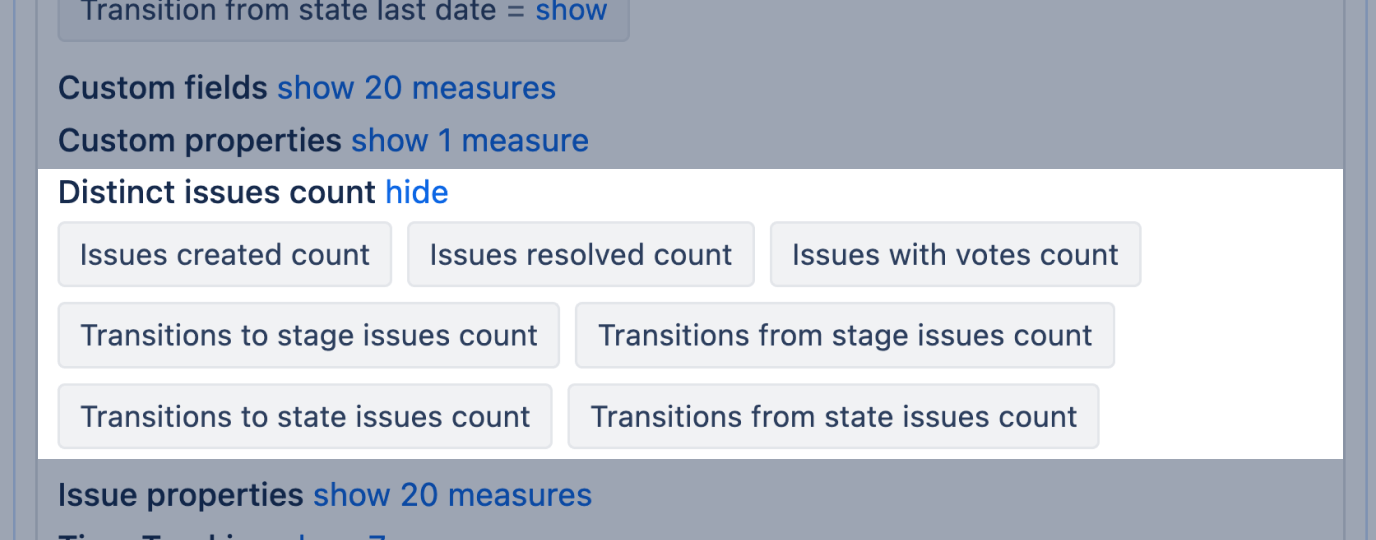
Issues created countIssues resolved countIssues with votes countTransition from <State> issues count | In the Distinct issues count measure group, the distinct (unique) count of issues is calculated. If import issue change history is selected then also Transitions to <State> issues count and Transitions from <State> issues count will be in this group. |
|---|
Time Tracking measures
eazyBI creates a set of additional measures organized in the predefined measures section, Time Tracking.
![]()
Original estimated hours | Total of original estimated hours. Used with the Time dimension, grouped by issue creation dates. |
|---|---|
Remaining estimated hours | Total of current remaining estimated hours. Used with the Time dimension, grouped by issue due dates for unresolved issues and by resolution dates for resolved issues. |
Issues with hours spent | Distinct count of issues that have any hours logged in the selected Time period. |
Issues with Original estimated hours | Count of issues with the original estimated hours. They are grouped by issue creation date in the Time dimension.
|
Hours Spent | Total of hours spent on issues matching the selected dimension members. On the Time dimension grouped by the start date specified in the worklog. The Logged by dimension can be used to see hours spent by individual users. You can drill through the cell to get a list of all worklog entries constituting a particular total hours spent value, with additional information -user name, date, issue key, as well as logged hours for this entry. |
Remaining estimated hours history | Total of remaining estimated hours at the end of the selected Time dimension period for issues that match the report filter criteria. |
Remaining estimated hours | Total of current remaining estimated hours. Used with the Time dimension, grouped by issue due dates for unresolved issues and by resolution dates for resolved issues. |
Remaining estimated hours change | Change (increase and decrease) in remaining estimated hours during the selected Time dimension period. For example, if there are logged hours in the period and the remaining estimated hours are adjusted automatically in YouTrack, "Remaining estimated hours change" would show the change equal to logged hours with a minus sign. On the other hand, if an issue gets estimated in the selected period, "Remaining estimated hours change" would show a change equal to the added estimation. |
Properties
Properties are calculated measures that return specific information about each dimension member.
Some properties are also available as dimensions (for example, <State> or Reporter), allowing you to analyze data by them. Others are directly related to measures — for instance, Issues created date relates to the measure Issues created. Certain properties, however, exist only as properties, such as Issue summary.
To display a property value in a report, use the members of the Issue dimension in the report rows to show issue properties.
Property values appear empty for higher-level members or when other dimensions are used in the rows. The same applies to calculated measures where properties are used in the formula.
By convention, property names usually start with the name of their related dimension — for example, Issue ...
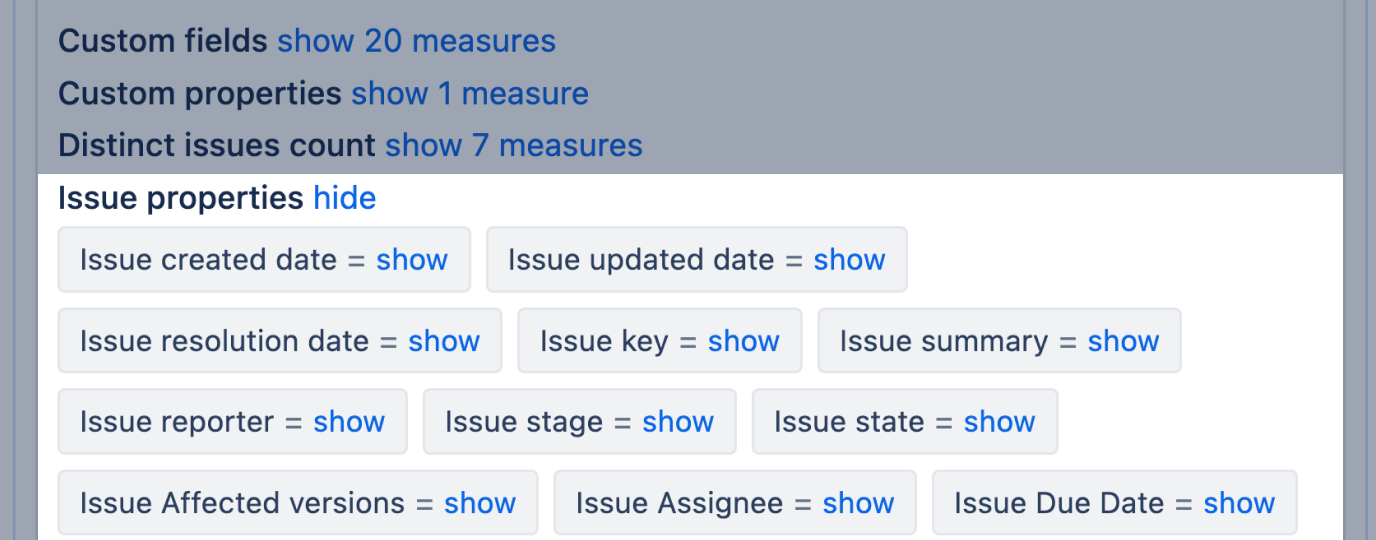
Issue created dateIssue updated dateIssue resolution dateIssue keyIssue summaryIssue reporterIssue <State> | If the Issue dimension is placed on rows and expanded to detailed issues, and these measures are placed on columns, then detailed creation, update, and resolution dates, as well as reporter, key, summary, and state of issues are shown. |
|---|