Usage statistics
eazyBI for Jira
eazyBI for Confluence
Private eazyBI
Overview
Usage statistics is an optional eazyBI feature that can be used to analyze eazyBI usage using eazyBI. If enabled then eazyBI report execution requests and source data imports are stored in a special usage statistics eazyBI account and usage statistics reports and dashboards can be created to analyze eazyBI usage. A set of default reports and a dashboard of these reports will be created in this account. You can use these reports to see the overview of daily usage, see top executed reports and dashboards, reports with errors or slow reports.
Time zone: Usage statistics activity is recorded in UTC on Jira Cloud and in the Jira server time zone on Jira Data Center. Because a single site can have multiple accounts spanning different time zones, one standard is used for consistency. If you are in a different time zone, please take this into consideration when reviewing the data.
On this page:
Enable in Data Center
Usage statistics can be enabled in eazyBI additional settings by Jira system administrator.
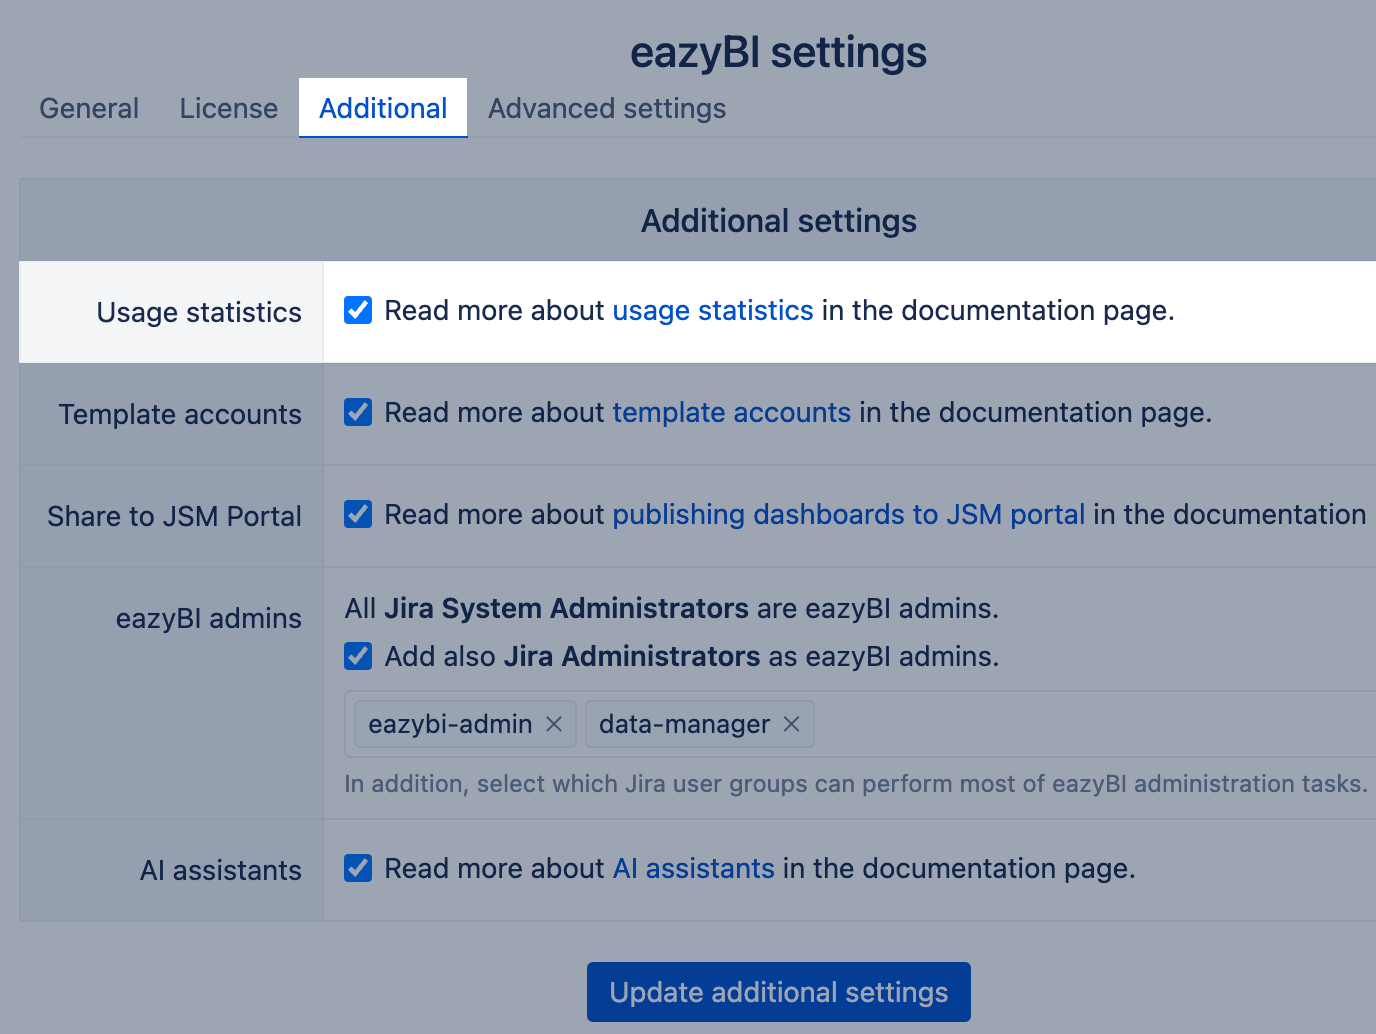
After saving the additional settings, a special (usage statistics) eazyBI account will be created which will be available to Jira system administrators. You can grant other Jira users or user groups access to this eazyBI account.
Report execution and import data are stored in a separate eazyBI database schema – eazybi_jira_dwh_stats on MySQL, dwh_stats on PostgreSQL or MS SQL, the same eazyBI user schema on Oracle. Report execution and import data are cached and the cache is cleared every 10 minutes – so you might see up to 10 minutes old data in your reports.
eazyBI will start collecting usage statistics once eazyBI advanced settings are updated and new feature is enabled.
You can disable usage statistics by disabling usage statistics option in additional settings. When usage statistics are disabled, then you can still view the collected historical usage statistics. If you do not need the history, then the (usage statistics) account can be deleted by the owner of this account.
By default, 1-year history of usage statistics data is stored. Older usage statistics entries are deleted during the eazyBI startup. You can increase or decrease how long history is stored by specifying the period (for example, 3 months or 2 years) in advanced settings:
[usage_statistics]
keep_for = "3 months"
Enable in Cloud
eazyBI collects and stores usage statistics for report executions and imports in Cloud by default in the background for monitoring and support purposes. Jira system administrator can enable the usage statistics in eazyBI general settings to get access to site-specific statistics on reports executions and imports.
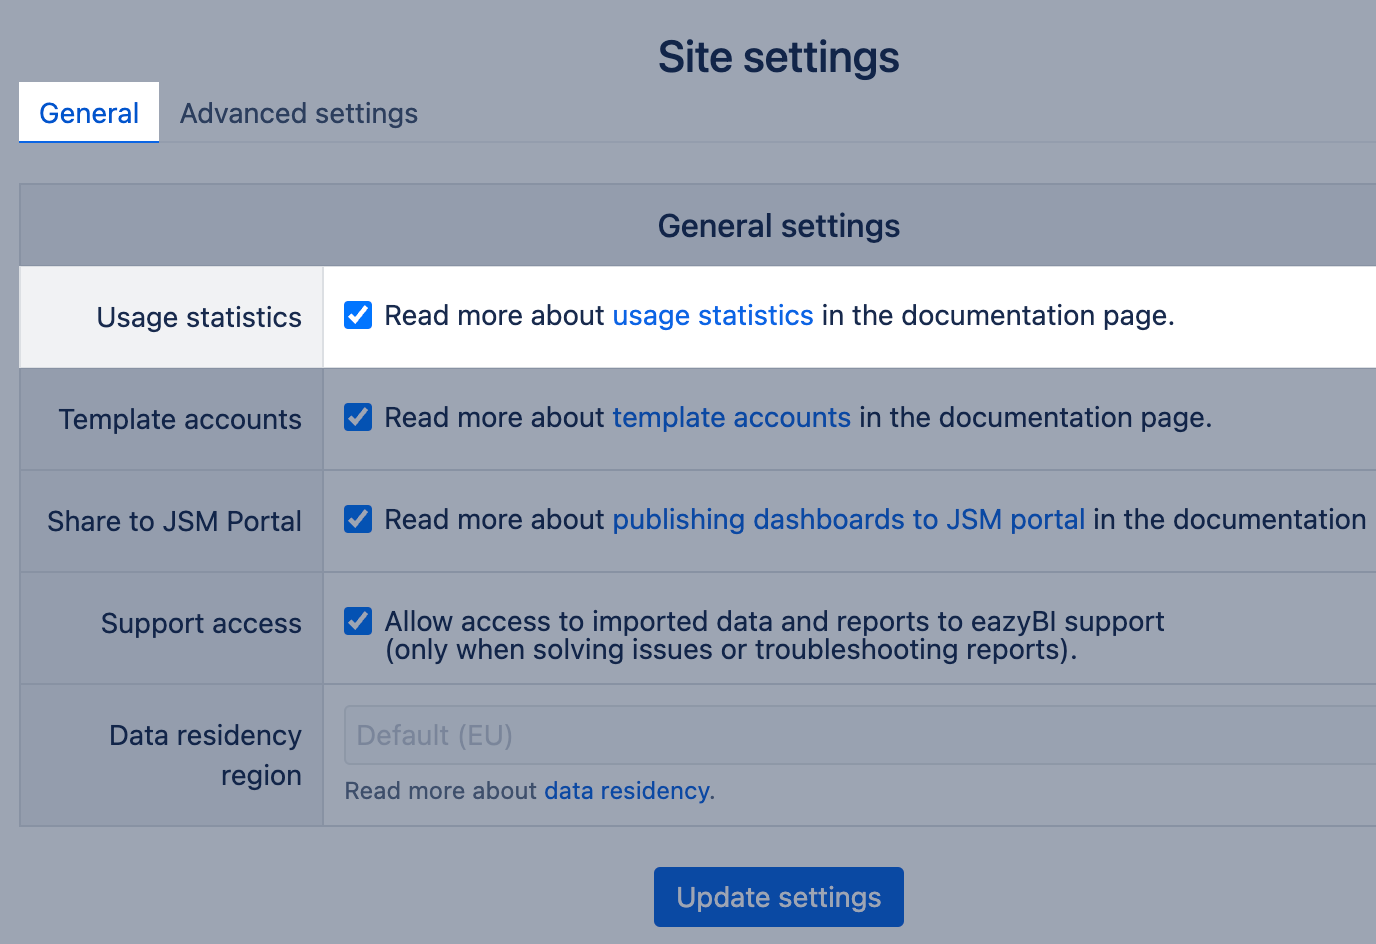
After saving eazyBI general settings a new special (usage statistics) eazyBI account will be created which will be available to Jira system administrators. You can grant access to other Jira users or user groups to this eazyBI account. eazyBI will share the already stored usages statistics data of report executions and import to the site usage statistics account.
You can start analyzing the eazybi usage in site with 1 year history of data in a few minutes after enabling the usage statistics option for cloud sites. Report execution and import data are cached and the cache is cleared every 10 minutes – so you might see up to 10 minutes old data in your reports.
You can disable usage statistics by disabling usage statistics option in general settings. When usage statistics are disabled, the usage statistics account will be removed from the site. You can restore the account with a default setup at any time.
Enable in Private eazyBI
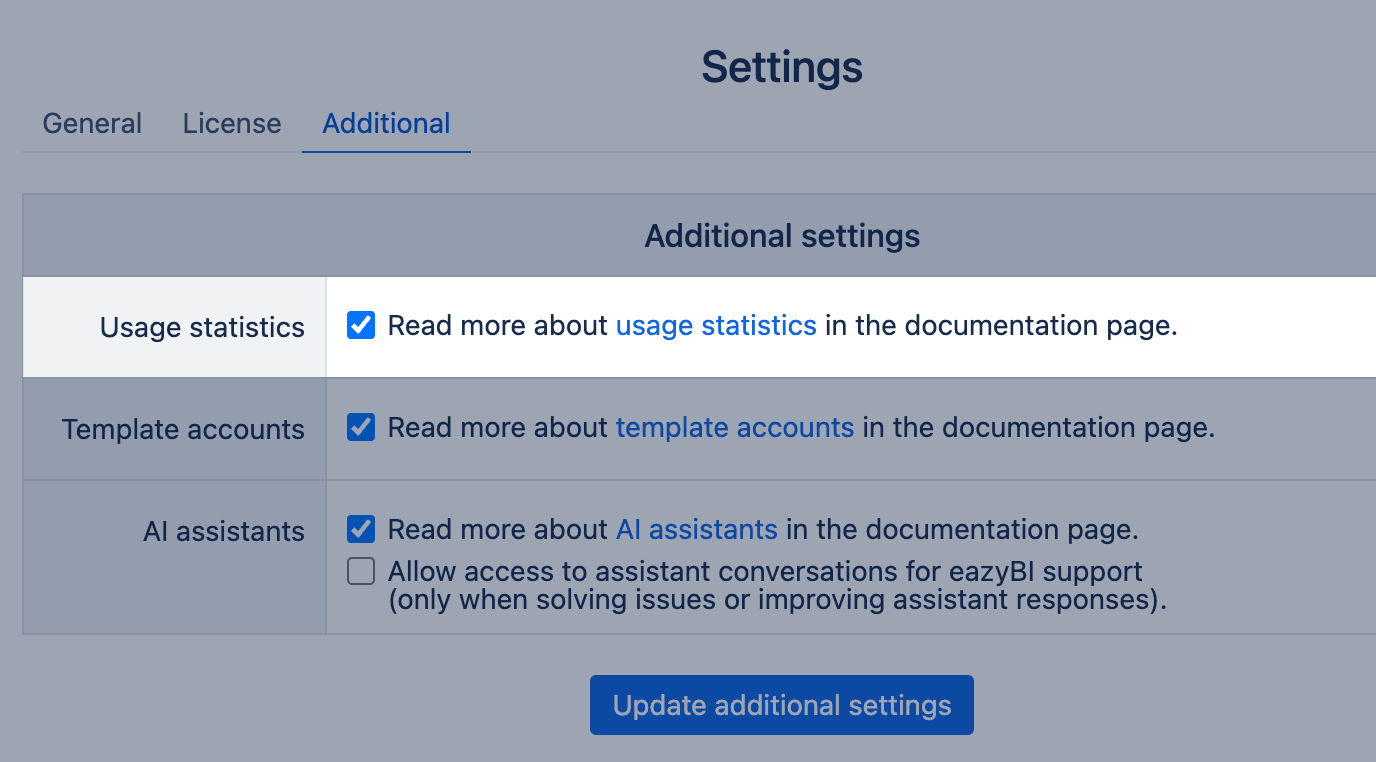
Usage statistics can be enabled in eazyBI Settings → Additional tab. This option is available since Private eazyBI version 8.0.
Instructions for the earlier Private eazyBI versions 7.x.
Data model
Here is a list of measures and dimensions that are available in usage statistics reports.
Measures
Accounts created | Count of eazyBI accounts created by users. If a deleted account is restored from the Audit log, it is also counted as created. The Time dimension groups data by the date the account was created. |
|---|---|
Accounts updated | Count of eazyBI account updates. The Time dimension groups data by the date the account was edited and updated. |
Accounts deleted | Count of deleted eazyBI accounts. The Time dimension groups data by the date the account was deleted. |
Reports created | Count of created reports by users. If a deleted report is restored from the Audit log, it is also counted as created. The Time dimension groups data by the date the report was deleted. |
Reports updated | Count of report updates. The Time dimension groups data by the date the report was edited and updated. |
Reports deleted | Count of deleted reports. The Time dimension groups data by the date the report was deleted. |
Dashboards created | Count of created eazyBI dashboards by users. If a deleted dashboard is restored from the Audit log, it is also counted as created. The Time dimension groups data by the date the dashboard was created. |
Dashboards updated | Count of eazyBI dashboard updates. The Time dimension groups data by the date the dashboard was edited and updated. |
Dashboards deleted | Count of deleted eazyBI dashboards. The Time dimension groups data by the date the dashboard was deleted. |
Sources created | Count of added data sources by users. If a deleted source is restored from the Audit log, it is also counted as created. The Time dimension groups data by the date when the source was added. |
Sources updated | Count of data source updates. The Time dimension groups data by by the date the source was edited and updated. |
Sources deleted | Count of deleted data sources. The Time dimension groups data by the date the source was deleted. |
Report Executions | A total number of first-time report executions when the report is opened (repeated executions are not counted when users change page selection or do drill actions). |
Report Execution Duration | Total first-time report execution time in seconds. Use the calculated measure of Average Execution Duration to get the average. |
Report Execution Errors | A total count of errors during the first-time report executions. Use the Report Execution Errors % calculated measure to see it as a percentage of total executions. |
Active Users | Unique count of users who used reports according to the selection of other dimensions. |
Active Accounts | Unique count of eazyBI accounts from which reports were used. |
Active Reports | Unique count of reports that were used. |
Active Dashboards | Unique count of dashboards which reports were used. |
Import Count | Count of source data import runs. |
Import Duration | Duration of imports. Use the calculated measure of the Average Import Duration to get the average. |
Import Errors | A total count of errors during the first-time import run. Use the Import Errors % calculated measure to see it as a percentage of total imports. |
Import Canceled | Count of manually canceled imports. |
Step Import Count | Count of steps executed during import. |
Step Import Duration | Duration of import of each step. Use the Average Step Import Duration calculated measure to get the average. |
Units Imported | Count of Source units imported with each import. Use the Average Step Import Duration calculated measure to get the average. |
Units Import Duration | Duration of import of each Source unit. Use the Units Imported Per Second calculated measure to get an average of how many units are imported per second. |
Dimensions
Account | eazyBI account – name and ID. Click on the dimension member and select Go to source to navigate to the Analyze tab of this account. |
|---|---|
Account Status | Current account status - active or deleted. |
Time | Date of activity logged in usage statistics. |
Hour | Hour of the day of the activity logged in usage statistics. On Jira Cloud, the hour is based on UTC; on Jira Data Center, it is based on the Jira server time zone. |
Week Day | The day of the week of the activity logged in usage statistics. |
| Dimensions for report execution analysis: | |
User | User – display name and email. |
Report | Reports grouped by Account, Cube, and Folder levels – name and ID. Click on the dimension member and select Go to source to open the report. |
Report Status | Current report status - active or deleted. |
Dashboard | Dashboards grouped by Account level – name and ID. Click on the dimension member and select Go to source to open the dashboard. |
Cube Type | Based on the data source – Jira or Custom. |
Report Type | Table or a specific chart type. |
Report Location | Where a report was located – Analyze tab, Dashboard, Gadget Dashboard or Gadget Report. |
| Dimensions for source data import analysis: | |
Import type | Full or Incremental import of source data. Incremental import could include Full data import of some import steps. |
Source | Individual source application or source file from which the import was done. On the Cloud, the Source dimension has an additional hierarchy By source type and host to group data sources first by type, host, and then individual data sources. Click on the dimension member and select Go to source to open the Source Data tab for the corresponding account. |
Source type | Source type, such as Jira, SQL, REST API, etc. Some source types could be expanded to Source Steps representing a step of an import (for example, Project import, Issue import steps in Jira import). |
Source Unit | Countable source units in import. For example, Issues, Projects, Objects, Rows, etc. |
Properties
You can select the most used properties from the Measures section.
Account site Account status Account imported issues count Account imported pages count Account imported objects count Account imported items count | They are used together with the Account dimension. The selected Account has several attributes: Atlassian site name, status, and imported object count (depending on the data source). |
|---|---|
User site | They are used together with the User dimension. Atlassian site name for the selected User. |
Report site Report account Report site or account Report cube Report cube type Report type Report status | Used together with the Report dimension. The selected Report has several attributes: Atlassian site, eazyBI account name, cube name and type, and report type, which you can pick from the Predefined measure section. However, there are several more properties for Report dimension which could be accessed through calculated measures using the function get():
For example, the expression to see report's last update date is this: --set measure formatting to Date / Time
[Report].CurrentHierarchyMember.Get('Updated at')
And expression to see the user name who made the last updated: [User].[User].GetMemberNameByKey(
[Report].CurrentHierarchyMember.Get('Updated by')
)
|
Dashboard site Dashboard account Dashboard site or account | They are used together with the Dashboard dimension. Atlassian site and eazyBI account name for selected Dashboard. |
Source site Source account Source site or account | They are used together with the Source dimension. Atlassian site and eazyBI account name for selected data Source. |