Days in cycles
eazyBI for Jira
On this page:
Overview
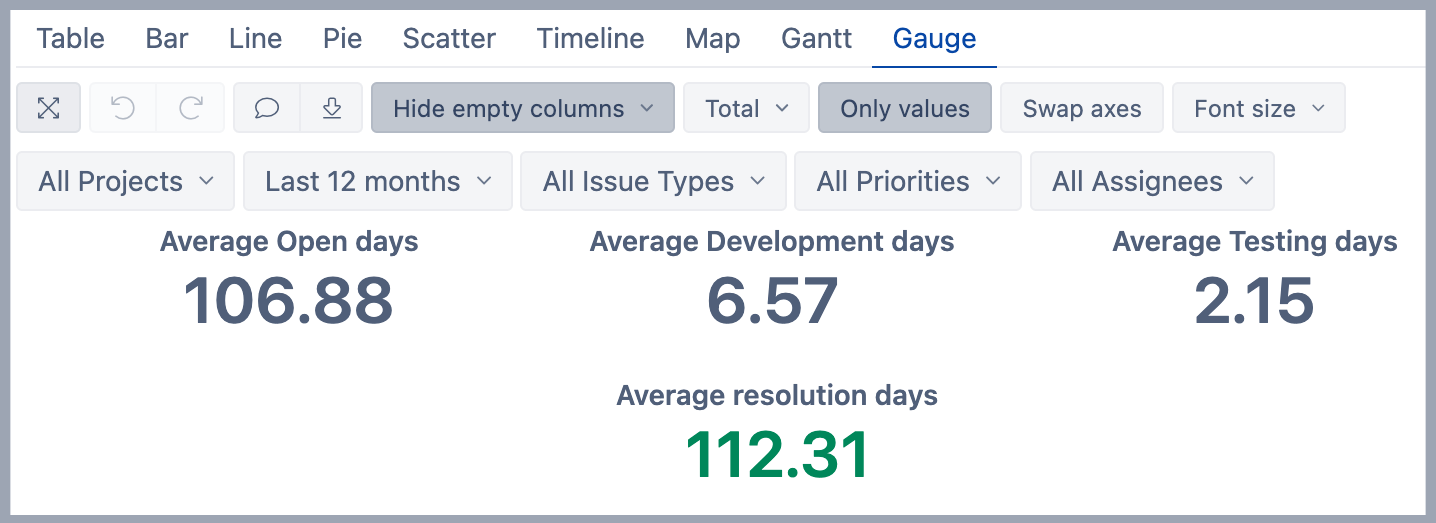
This report shows how many days have been spent on average in each cycle, all measures are displayed together with average resolution days in the selected time period.
How to build it
To build this report start with a table view and in the Measures dimension select measures Average <Cycle Name> days and Average resolution days.
- "Average <Cycle Name> days " hows average days of the total time the issue spent in any status of the cycle and currently is not in the cycle. On the Time dimension, grouped by the last date when the issue moved from the cycle to any other not-cycle status
- "Average resolution days" calculates average resolution days of resolved issues (that are counted in "Issues resolved") and are grouped by issue resolution date on the Time dimension.
Use the Time dimension in Rows. Configure Time dimension as is more comfortable, e.g. "Monthly" to see how many issues were for each measure at the end of each Month.
In the report Rows add the Project dimension. Add the same Project dimension to Pages for filtering report data.
Add Time dimension to Pages for filtering report data and select predefined calculated member Last 12 months from Time dimension and use it to filter the report data. From the Time dimensions select also calculated members "All Times", "Current month", "Previous month", "Current year", and "Previous year" so they are available in Page filter options.
In Pages select "Issue type", "Priority", and "Assignee" dimensions.
Then switch to the Gauge view and select only values from to toolbar. For the measure Average resolution days set a different color.
See also
- Learn about Issue Cycle measures.
- See more about options that are available when you create a report.
- Learn how to modify different chart types.
- See training videos to learn more.