Issues in cycles
eazyBI for Jira
On this page:
Overview
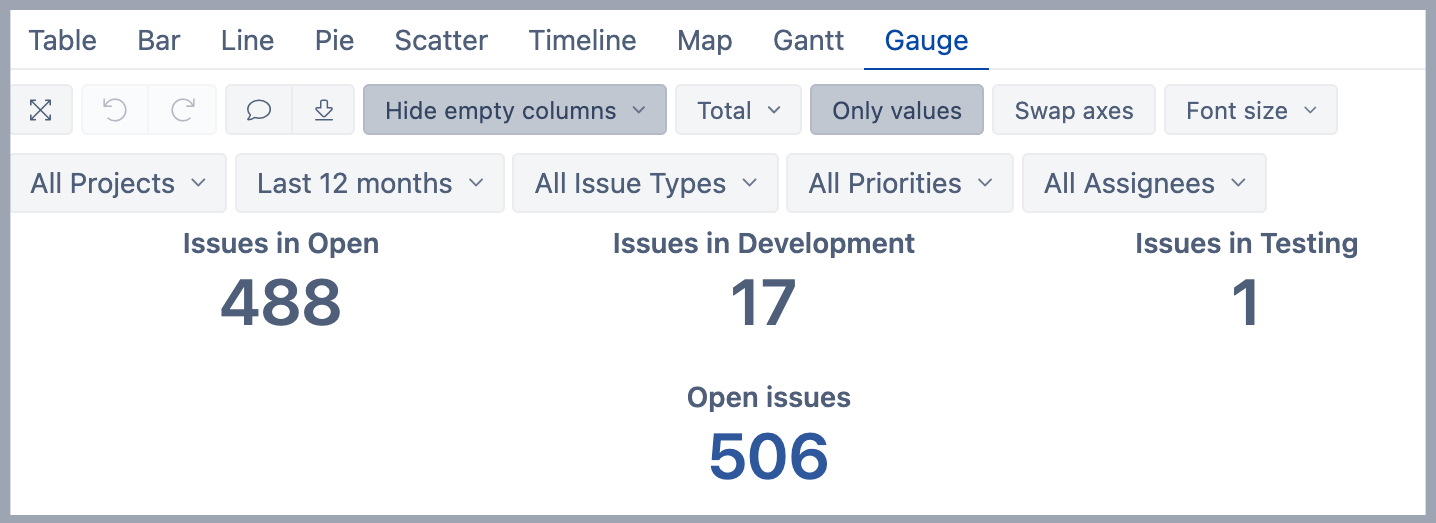
This report shows how many issues have been in each cycle, all measures are displayed together with open issues at the end of the selected Time period.
How to build it
To build this report start with a table view and in the Measures dimension select measures Issues in <Cycle Name> and Open issues.
- "Issues in <Cycle Name>" is a number of issues in the progress cycle at the end of the corresponding Time dimension period (as "Issues Progress started" minus "Issues Progress ended" from the beginning of the time until the end of the selected time period).
- "Open issues" calculate what is the number of unresolved issues at the end of the corresponding Time dimension period or how many issues have been created and are still without the resolution. The measure counts issues from the beginning of the time until the end of the selected time period.
In the report Rows, select the Project dimension. Add the same Project dimension to Pages for filtering report data.
Add Time dimension to Pages for filtering report data and select predefined calculated member Last 12 months from Time dimension and use it to filter the report data. From the Time dimensions select also calculated members "All Times", "Current month", "Previous month", "Current year", and "Previous year" so they are available in Page filter options.
In Pages select "Issue type", "Priority", and "Assignee" dimensions.
Then switch to the Gauge view and select only values from to toolbar. To the measure Open issues set a different color.
See also
- Learn about Issue Cycle measures.
- See more about options that are available when you create a report.
- Learn how to modify different chart types.
- See training videos to learn more.