Samples DevOps reports and dashboard
eazyBI for Jira
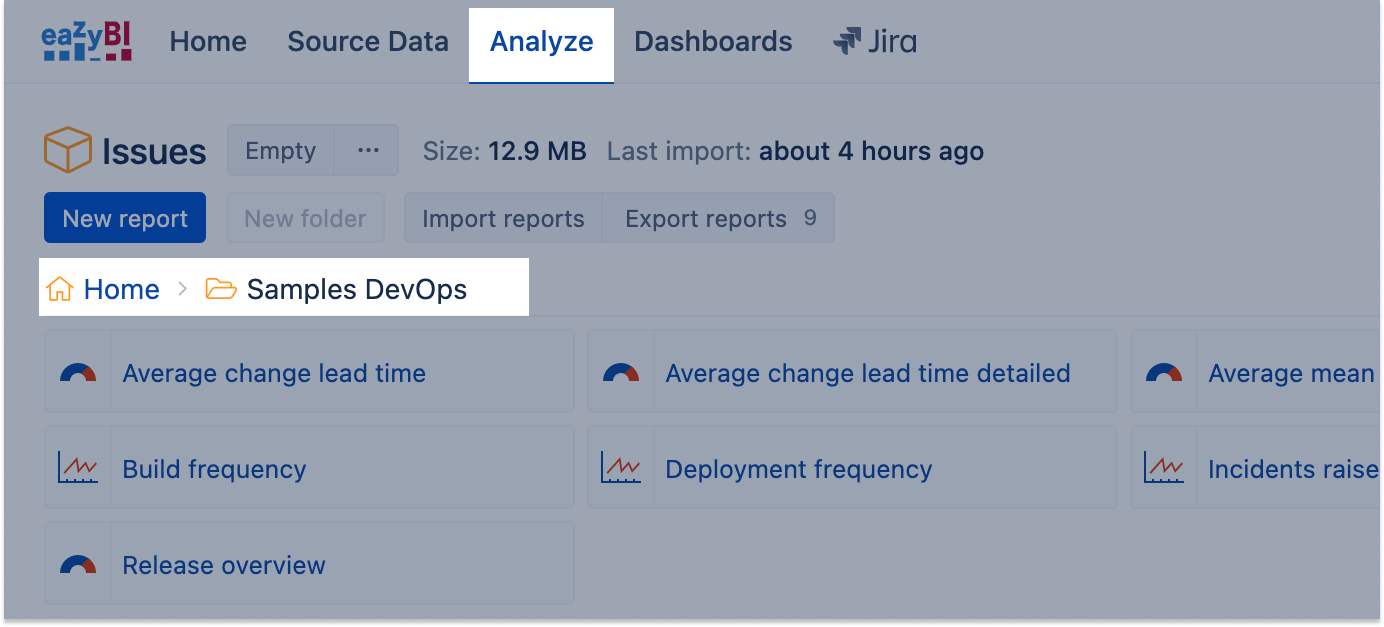
If you have selected to Import sample reports, eazyBI will create several DevOps report examples in a new folder named Samples DevOps. In this folder, you will find a collection of most essential DevOps metric examples - from Build, Deployment frequency to Change lead time, Failure rate and Mean time to recovery. The metrics combine already existing Jira issue data in the cube (Incident and Change issue life cycle) as well as BitBucket, Bamboo, and Jenkins data. More information about the available measures and dimensions you will find here.
Few important things about the DevOps reports:
- The Project dimension is in Pages for filtering, and the top three projects with DevOps data are selected.
- eazyBI also organizes the sample reports in one SampleDevOps metrics dashboard that gives an overview of the DevOps processes in these top three DevOps projects.
- By default, all DevOps Sample reports are filtered by the Last 12 months in the Time dimension.
Standard DevOps metrics require data of the full Issue life cycle. eazyBI will create measures and sample reports for imported data set - Pull requests, and Builds. Some measures and reports require both data sets and will not be created if some data will be missing. The DevOps dashboard will be created if there are data for the full request life cycle.
- Deployment Frequency
- Build Frequency
- Build failure Rate %
- Incidents raised vs resolved
- Release overview
- Average change and recovery time
- Average change lead time
- Average change lead time detailed
- Pull requests overview