
Logged hours by project and user over last weeks
eazyBI for Jira
On this page:
Overview
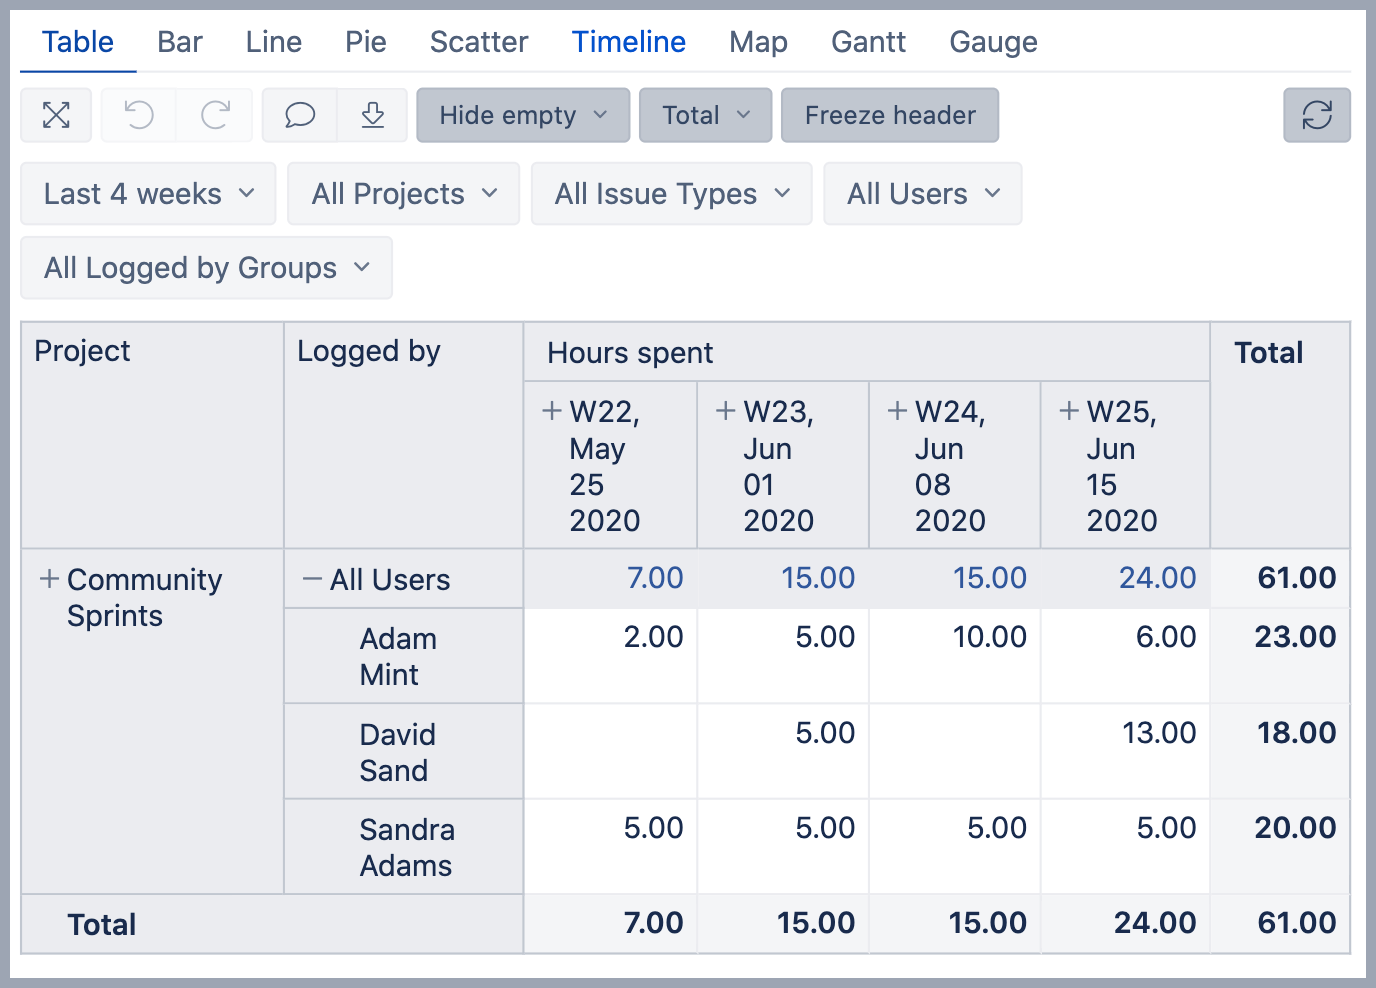
This report shows how many hours have been logged by project and user over the last weeks.
How to build it
In the Measure dimension select measure Hours spent and unselect default measure Issues created. Measure Hours spent is a total of hours logged on issues matching the selected dimension members. You can Drill trough cell to get a list of all worklog entries constituting particular Hours spent total value, with additional information -user name, date, issue key, worklog comments, as well as logged hours for this entry.
In Rows select Project dimension and select "Project" level and enable Nonempty option for Rows. Next to it add the Logged by dimension and in the report expand "All Users" member, with this you can see hours spent by individual users and at "All Users" level aggregated value from all users below or in other words - the total from all users. For "All Users" member use cell formatting so it is more visible in the report that this member contains an aggregated value.
For both dimensions in the table select to display the dimension name in the header.
From toolbox select options Hide empty rows and columns to hide projects and users that don't have logged hours for selected time period, Total of rows and columns to show total hours per row and columns, and Freeze header if the report gets long and wide.
Add Project and Logged by dimensions to Pages for filtering report data.
In Column add Time dimension and select "Week" level from "Weekly" hierarchy. Add the same Time dimension to Pages for filtering. Select from Weekly hierarchy members All Time, Previous Week, Current Week, and Last 4 weeks. In the report choose the Last 4 weeks so the data in the report is filtered by this time period.
In Pages also select "Issue type" and "Logged by Group" dimensions for filtering.
See also
- Learn about different Jira Core measures and dimensions - what they are and how they work.
- See how to add Groups for Assignee, Reporter and Logged by or Transition author in import options.
- See more about options that are available when you create a report.
- Learn how to modify different chart types.
- See training videos to learn more.
- See the report in the eazyBI demo account.