Data from monday.com
eazyBI.com
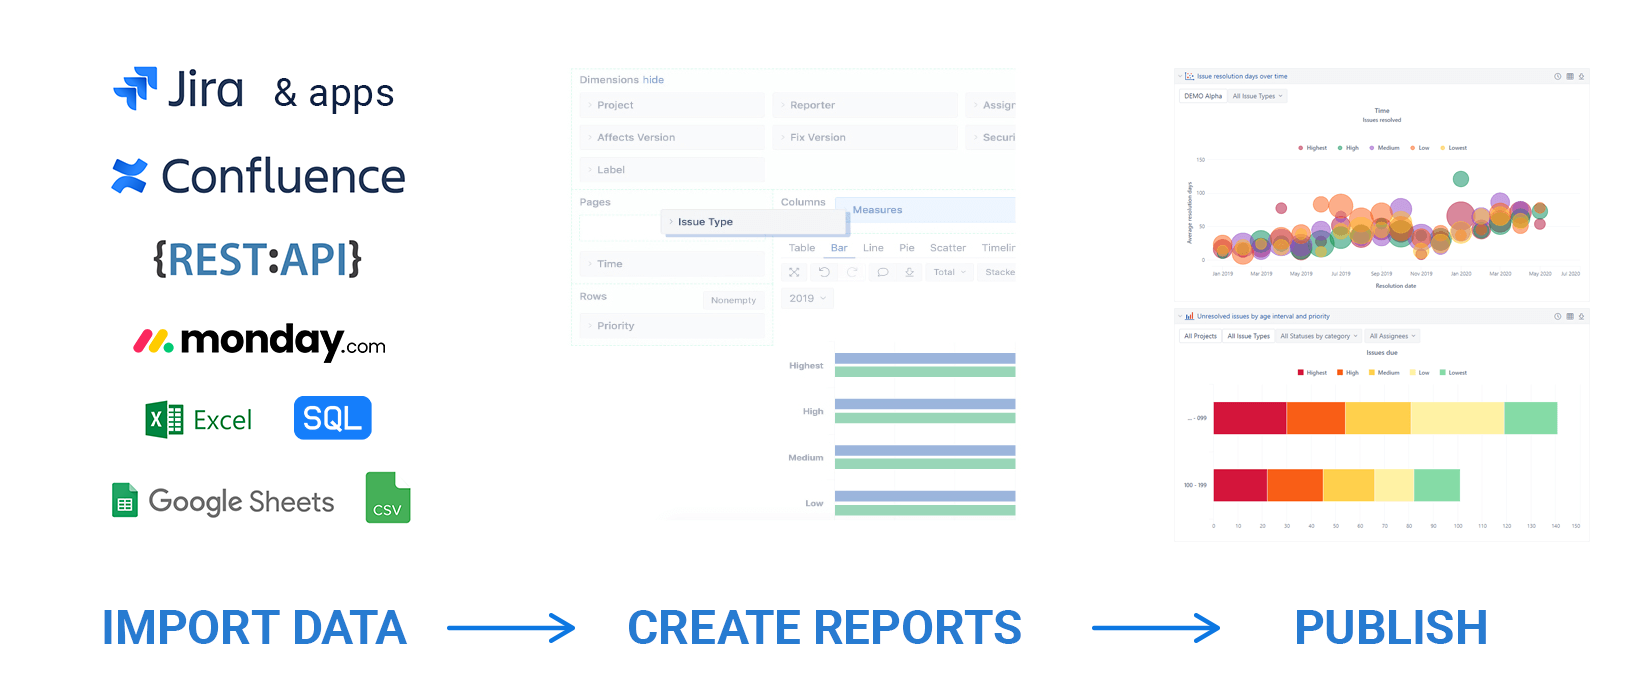
monday.com app is a Work Operating System (Work OS) that powers teams to run projects and workflows with confidence. It’s a simple but intuitive Work OS for teams to shape workflows, adjust to shifting needs, create transparency, connect collaboratively, and stop doing manual grunt work.
eazyBI extends the monday.com reporting suite with an advanced, easy-to-use, flexible visualization, analysis, and reporting. You can create an eazyBI account and perform your first import in minutes. Regular daily updates import data automatically, so your charts will always have the latest data. eazyBI has several predefined sample reports, charts, and a dashboard to get you started. You can easily create custom reports, charts, and dashboards for your specific needs. eazyBI imports and allows data analysis for Item, Creator (Users), Logged by, Status, Workspace, Board, and Group.
Home
The main view of the eazyBI Report Builder is the Home tab, where you can see the list of all the accounts you have access to or create new accounts. Accounts enable you to separate and manage access to different data sets for different users and user groups. Within each account you can manage user access, data sources, reports, and dashboards (learn more about eazyBI accounts).
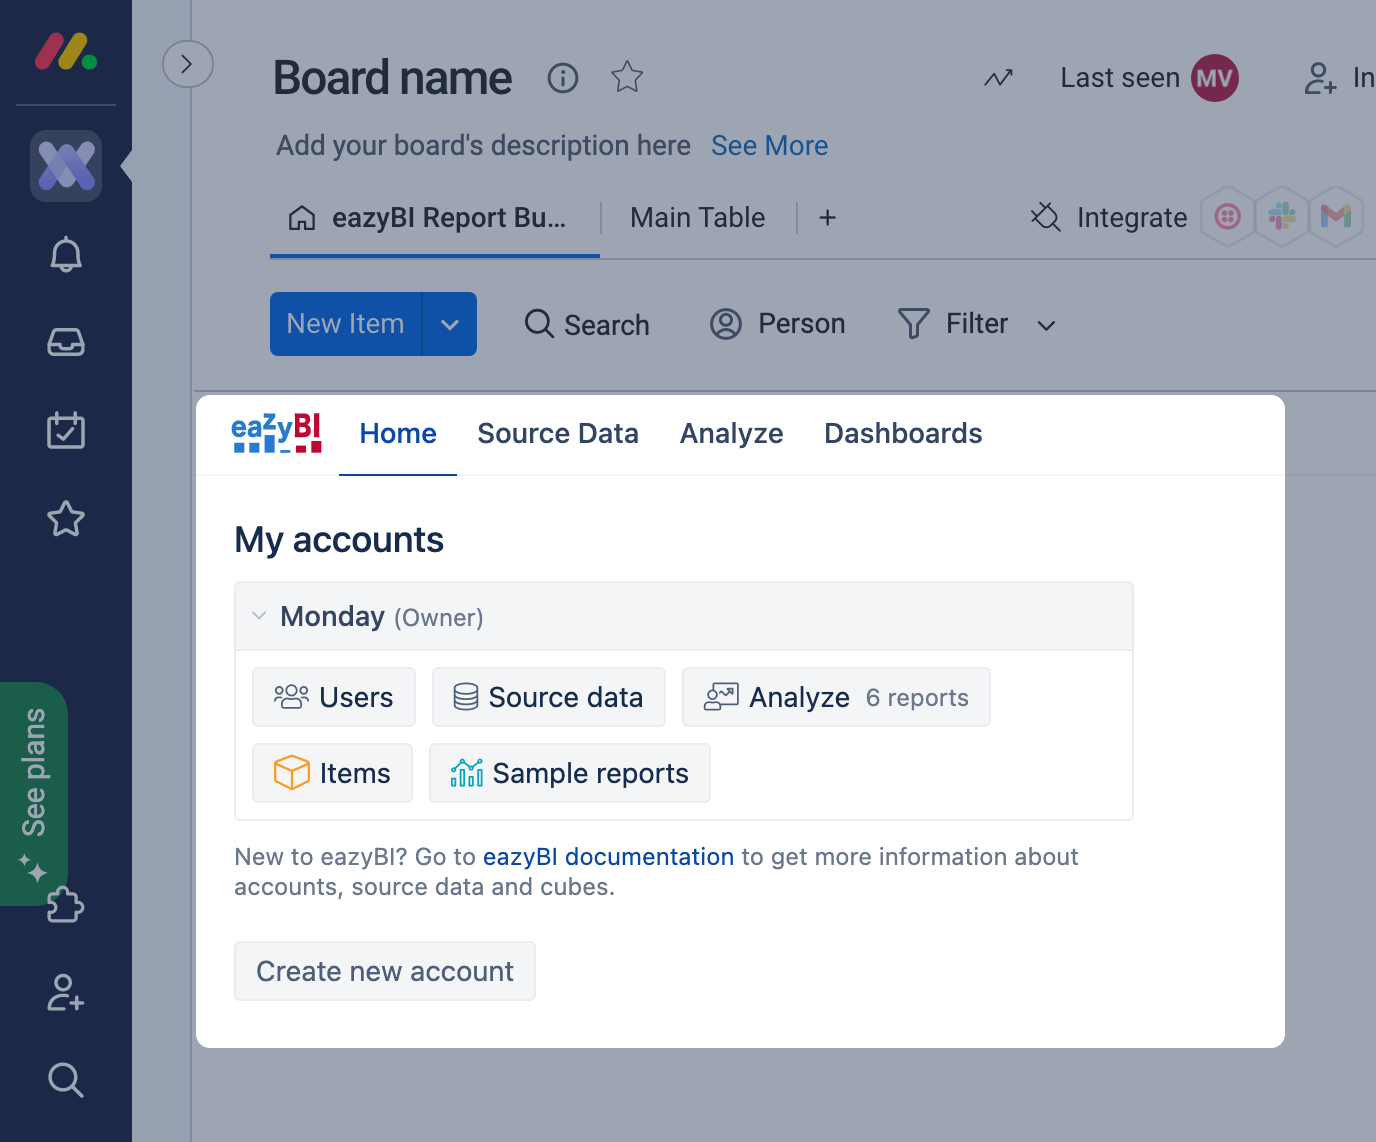
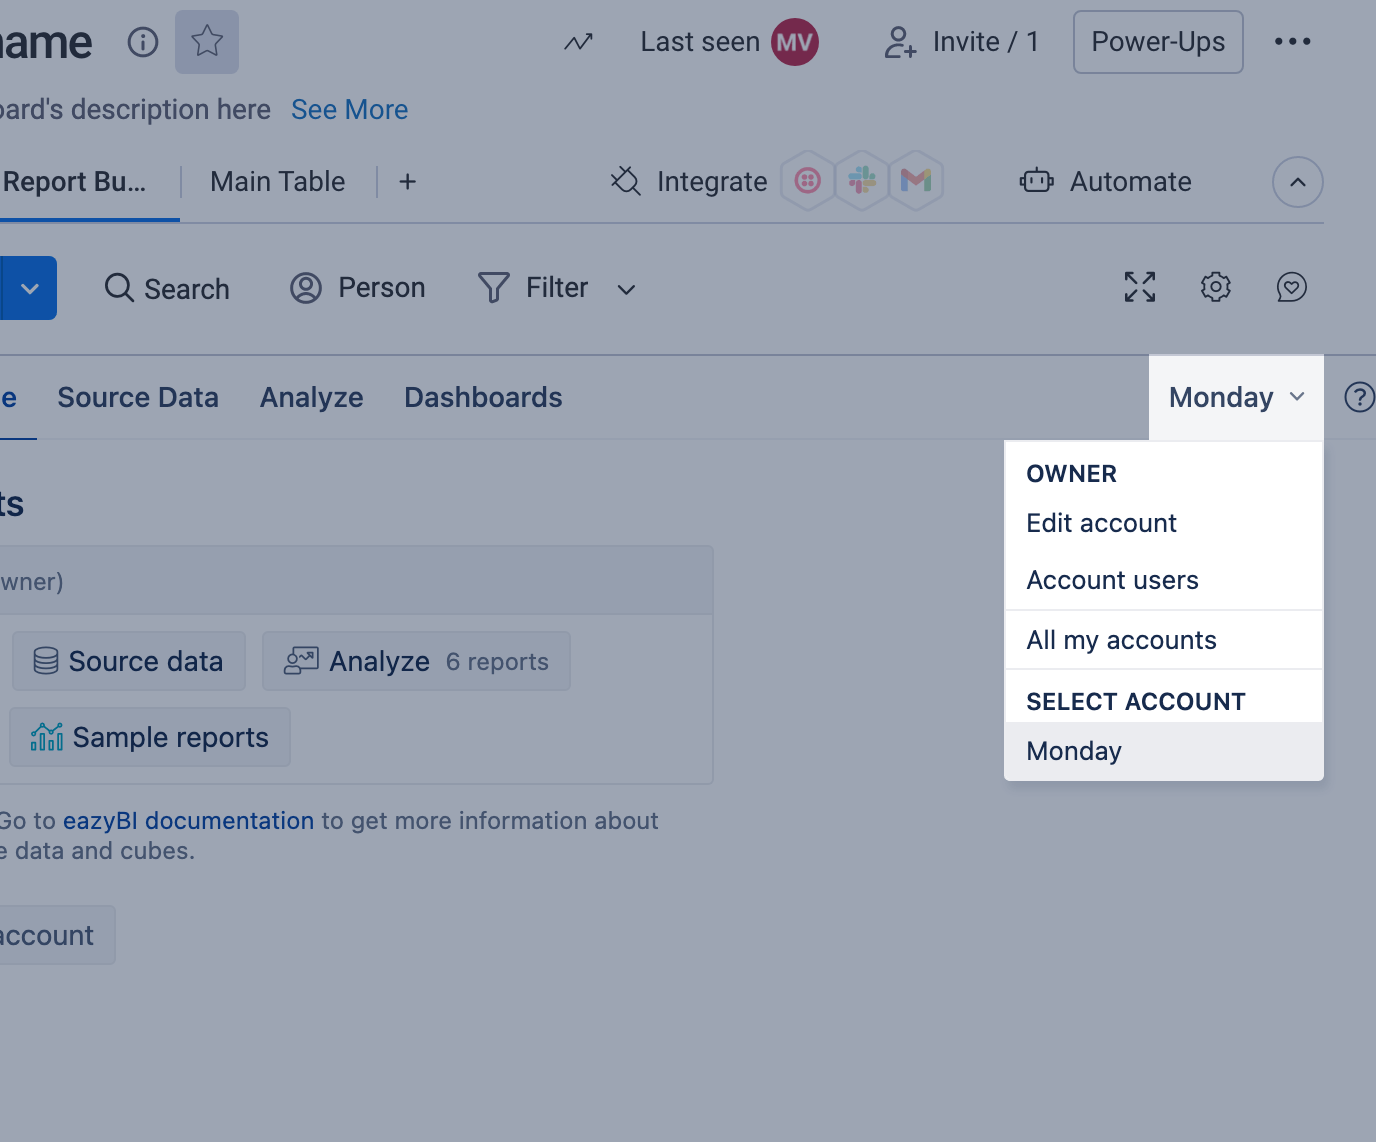
In addition, you can access and manage the active account or switch to other accounts from the top-right menu.
Source Data
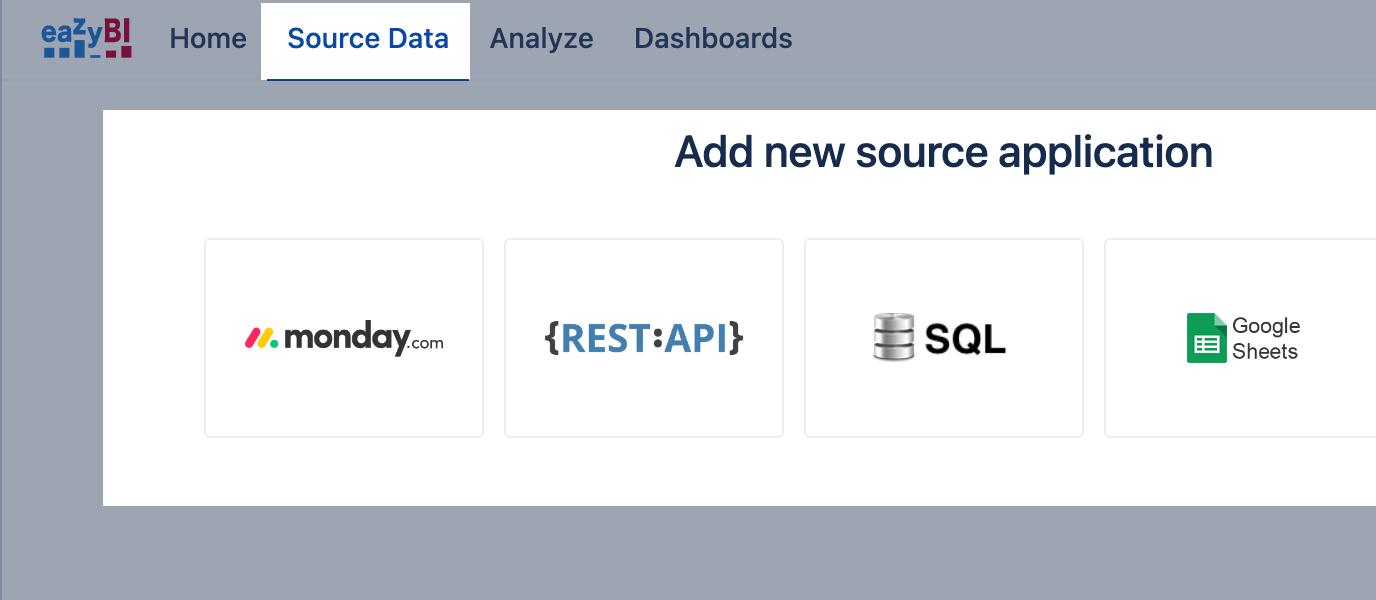
The Source Data tab lets you see connected data sources in the active account or add new ones. See data import on how to import monday.com data.
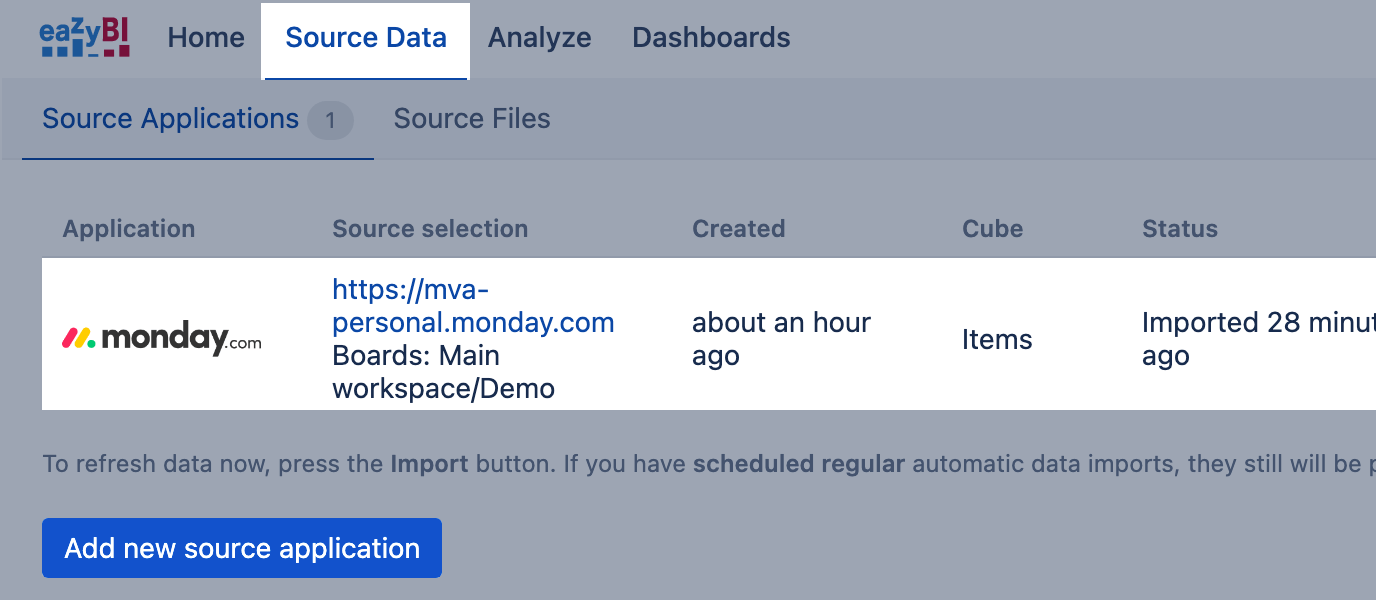
You can connect multiple data sources in each account or create separate accounts for different data sets. (Learn more about adding additional data sources.)
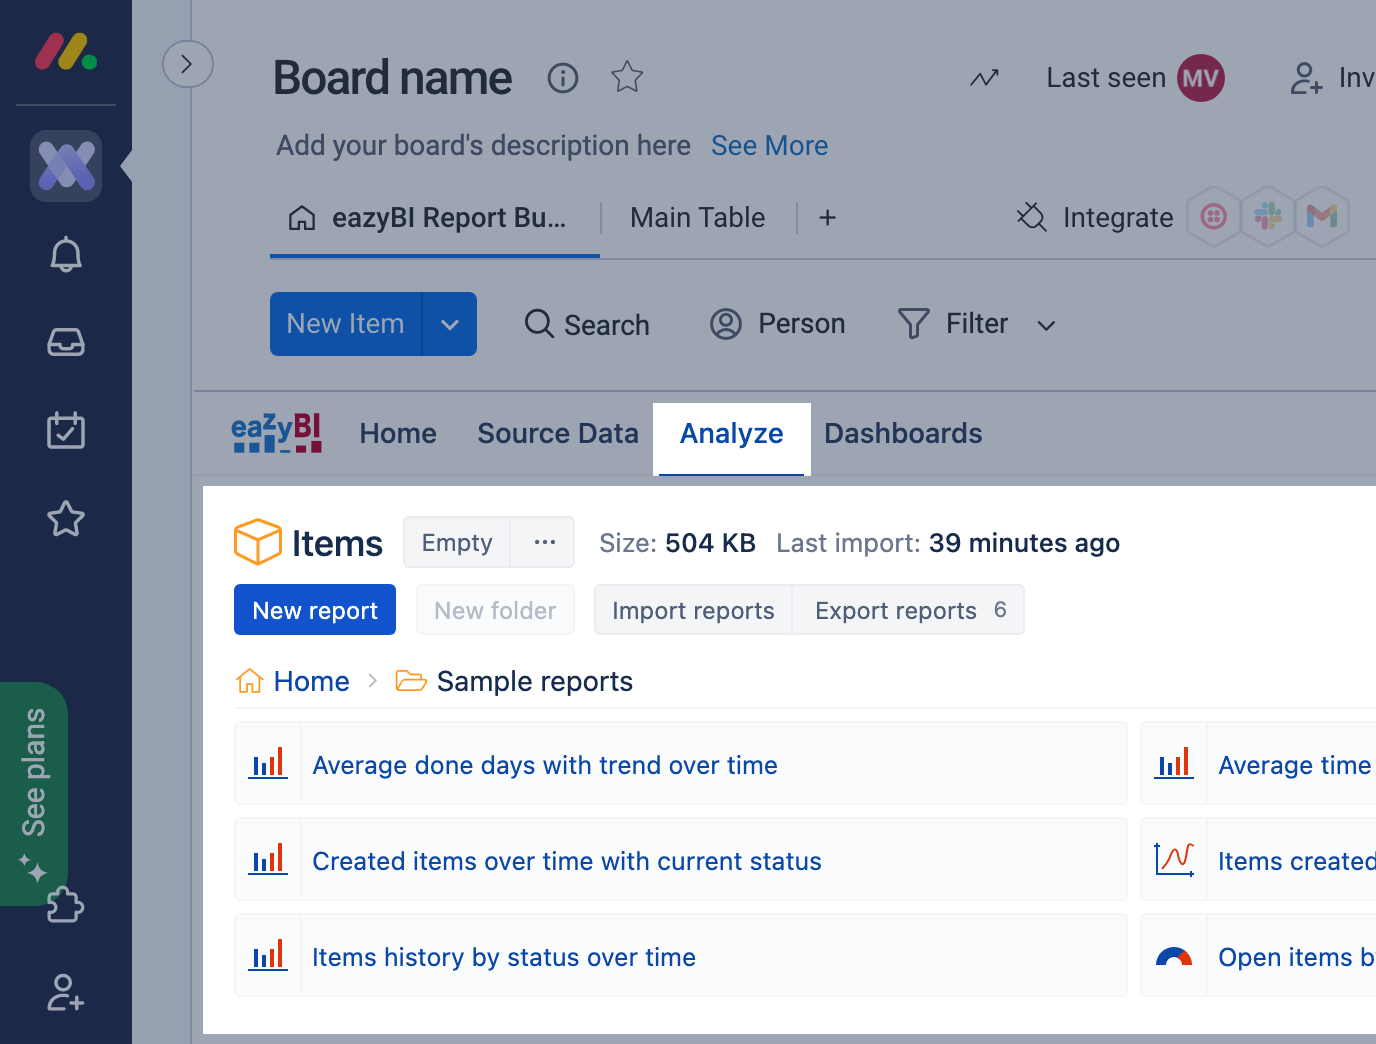
Analyze
In Analyze tab, find, organize, and manage all your reports in the selected account. You can search for a particular report, create new reports and folders, or export and import report definitions (i.e., reports without actual data) into or from other accounts.
The "New report" button opens the eazyBI report builder, which provides a user-friendly interface for creating custom reports. With the report builder, you can easily create reports by dragging and dropping dimensions and measures, allowing you to interact with your data. There you have the ability to select and customize various chart options to visually represent your data.
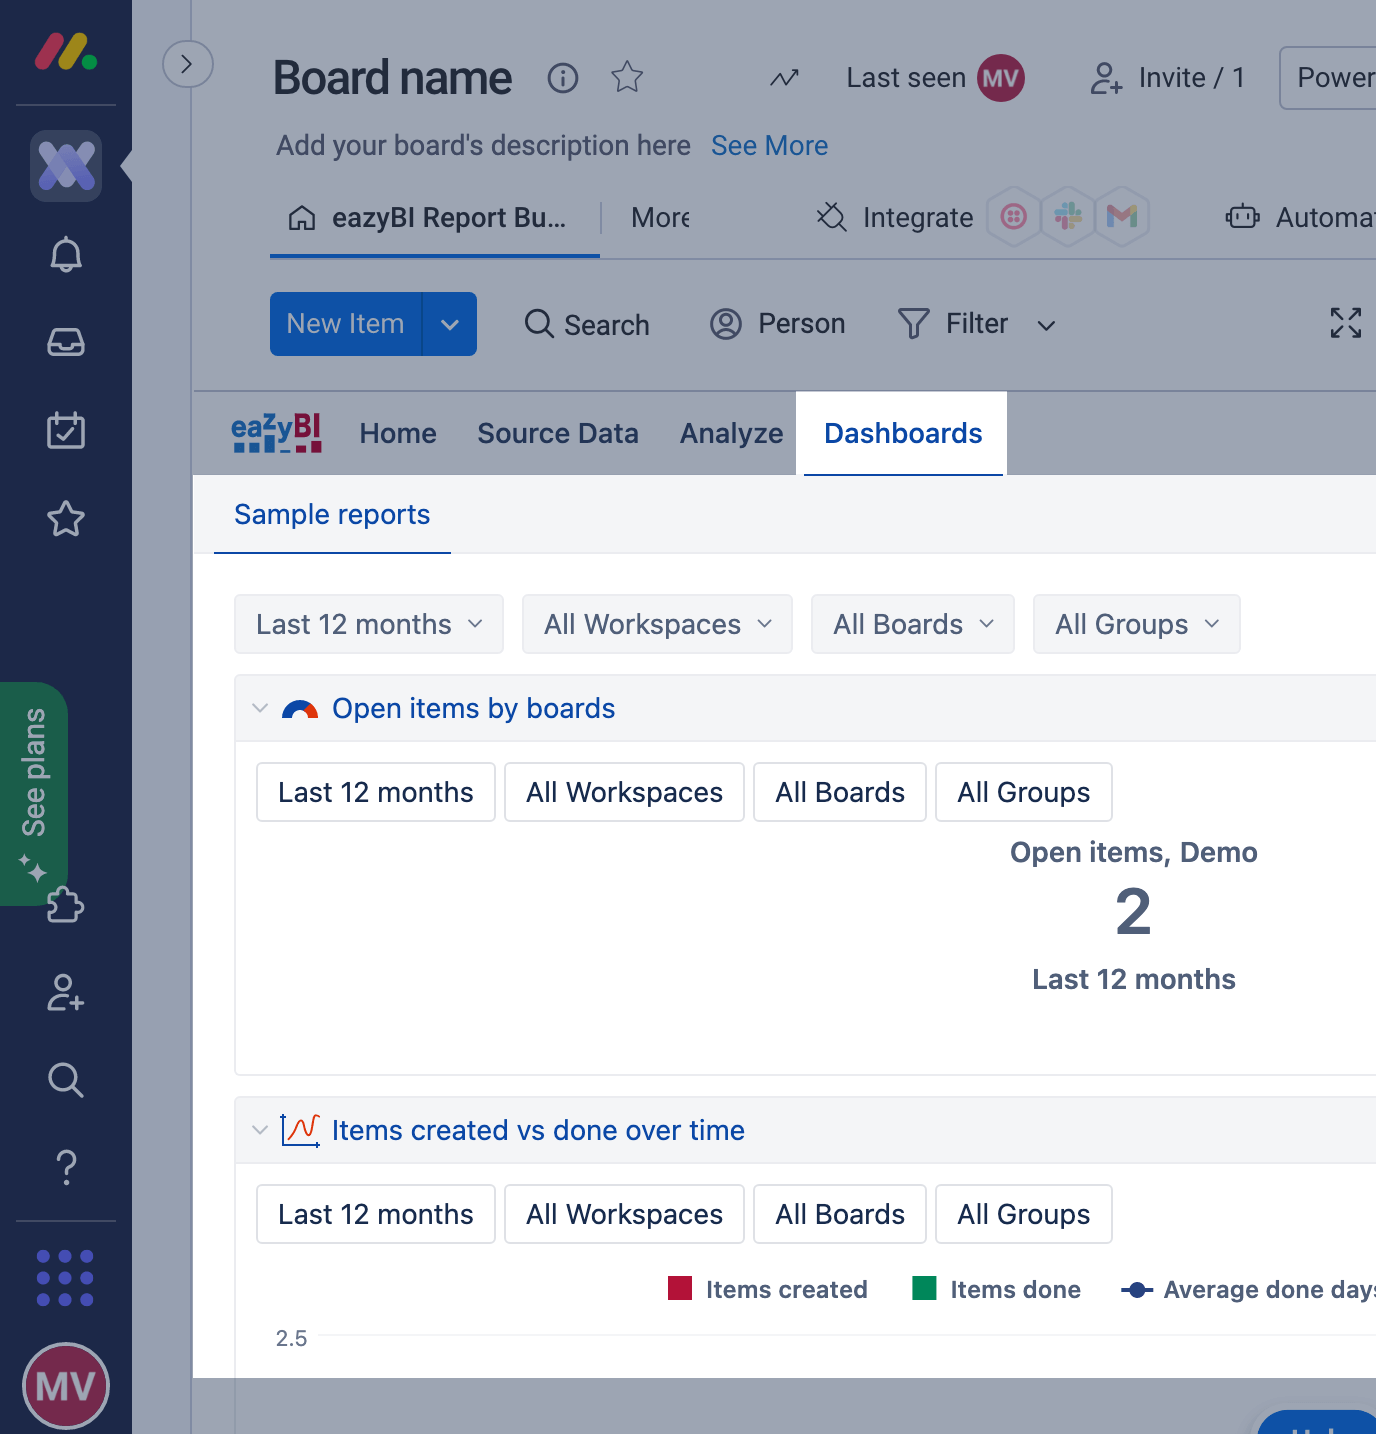
Dashboards
The Dashboards tab lists all your eazyBI dashboards in the selected account. Here you can edit existing dashboards, create new ones, download dashboards as a PDF, or subscribe to receive scheduled reports as PDF files in your email. You can also export and import the entire dashboard from one account to another.