Data model
Data model definition organizes elements of data, standardizes how they relate to one another, and provides the details of the information to be stored.
In eazyBI, the data model describes how data are structured within a single eazyBI account, with one or more data cubes.
On this page:
What is a data model
In the eazyBI, you can create one or several accounts. Each eazyBI account is a data warehouse with a certain structure based on the data you import.
Imported data are organized in tables and related to each other. There are fact tables and dimension tables where eazyBI imports and stores data from data source. eazyBI account has to have at least one fact table with measures and at least one dimension to group data; that would be a very simple data model. But in most cases, imported data are stored in a multi-dimensional data cube; cubes contain fact data divided by dimensions, and each detailed fact “cell” contains measure values about that fact.
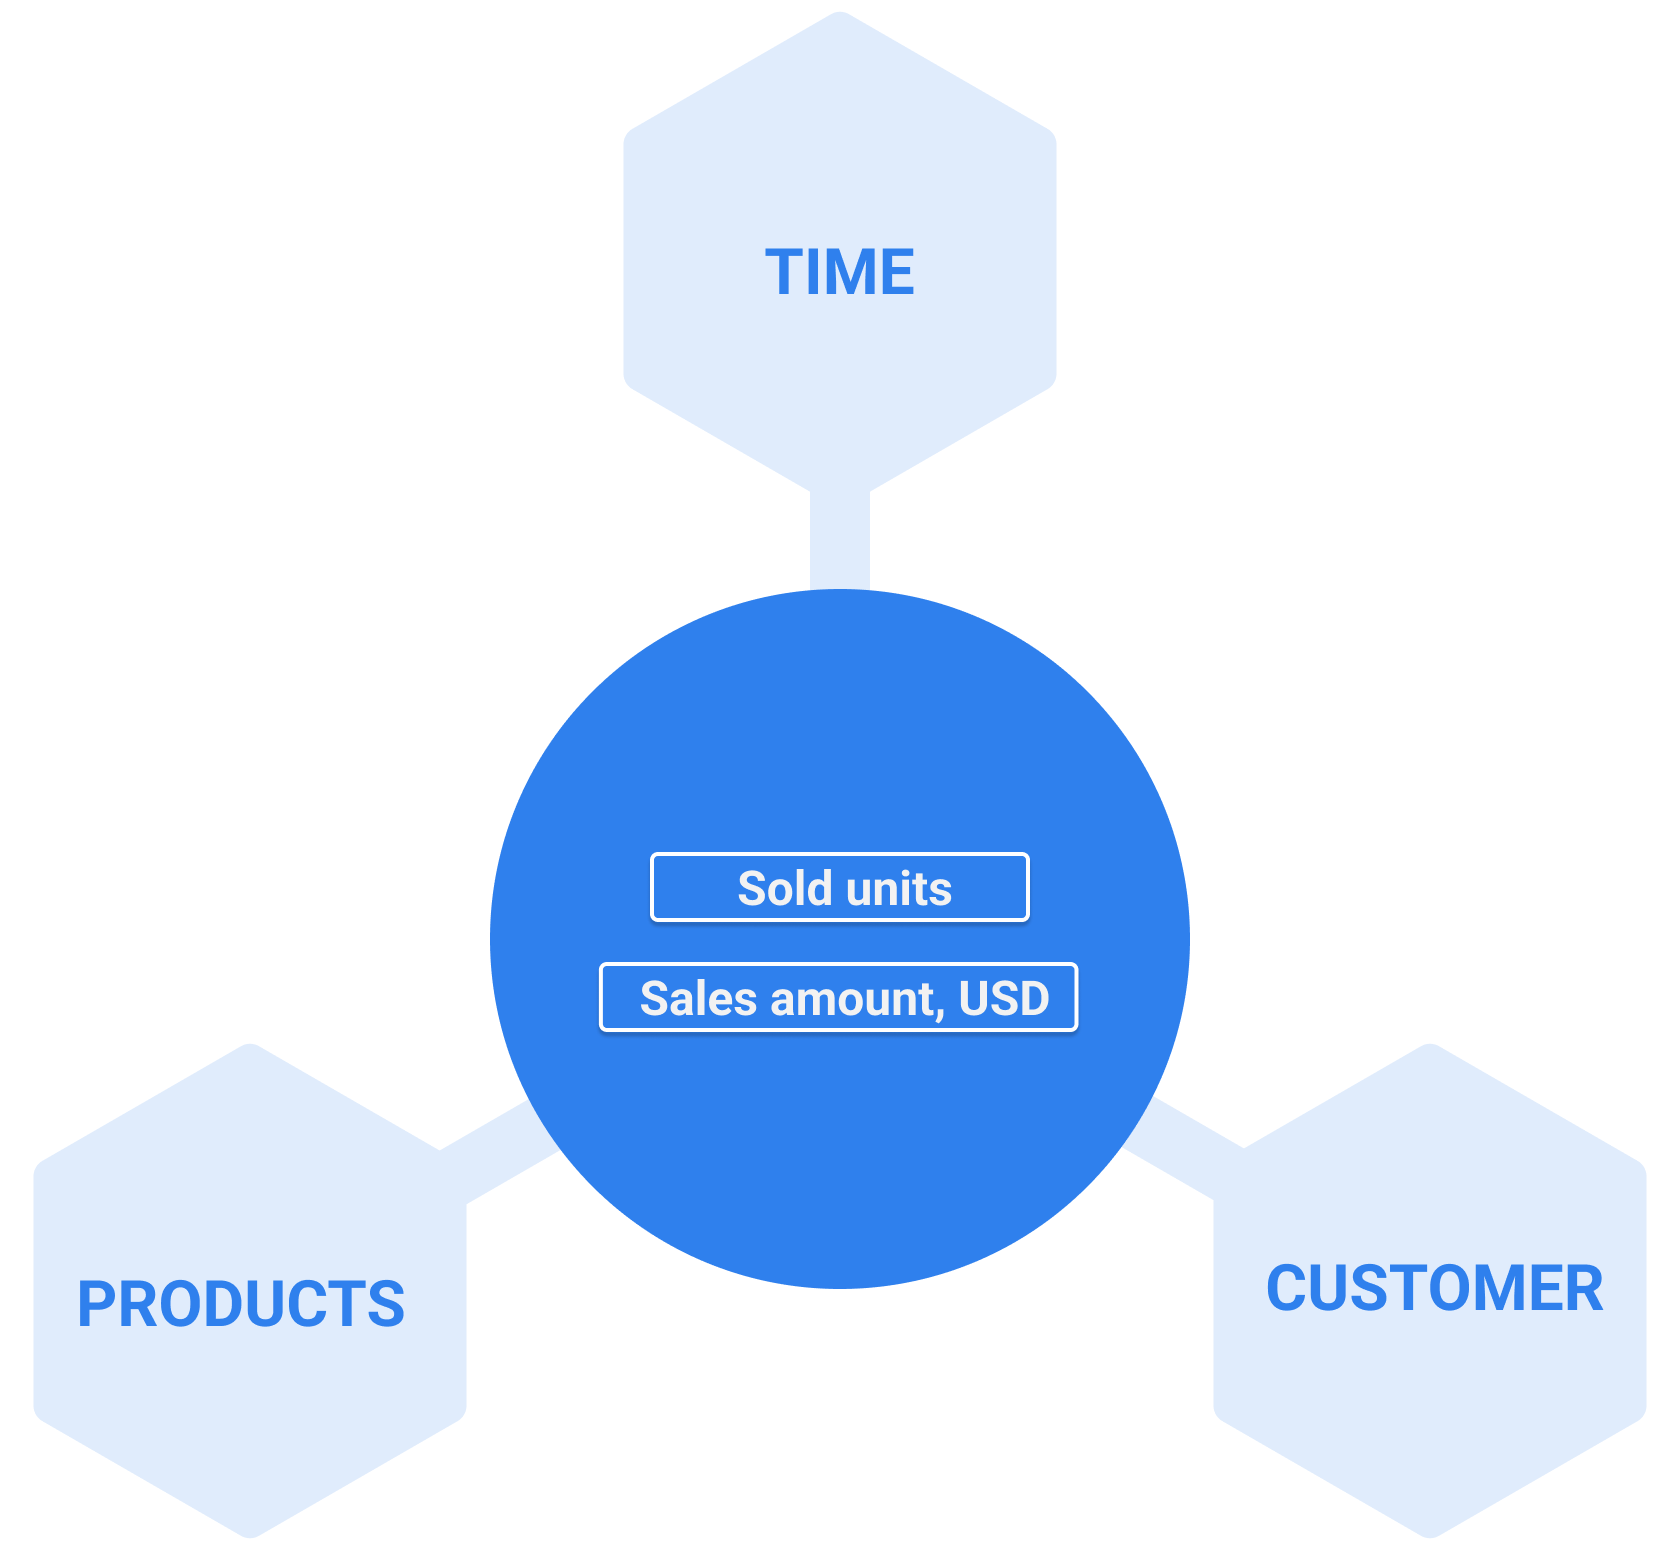
It is easy to illustrate a data model with the help of a star schema.
Example for Sales cube. The data source contains customers, products, date of purchase, and quantity details of how many units and the sale amount. During data import, eazyBI creates a data model with four tables:
- one fact table with two facts – sold units and sales amount,
- three dimension tables – Customer, Product, and Time representing the date.
The star schema for the Sales data model would look like below.
Who is responsible for the data model
The account users with Owner or Data admin roles are responsible for the data model in the eazyBI account. They can edit import options for a data source, thereby changing the data model. For example, add new or remove existing fields from the current data model.
Working with the data model
Before you start, think of the following questions that will help you shape the data model:
- What do you want to measure?
- How do you want to group and filter data?
- How do you want to use date fields in reports?
eazyBI generates a data model based on the imported data. You can map data from external data sources or use one of the integrations – Jira, Confluence, monday.com, and other integrations.
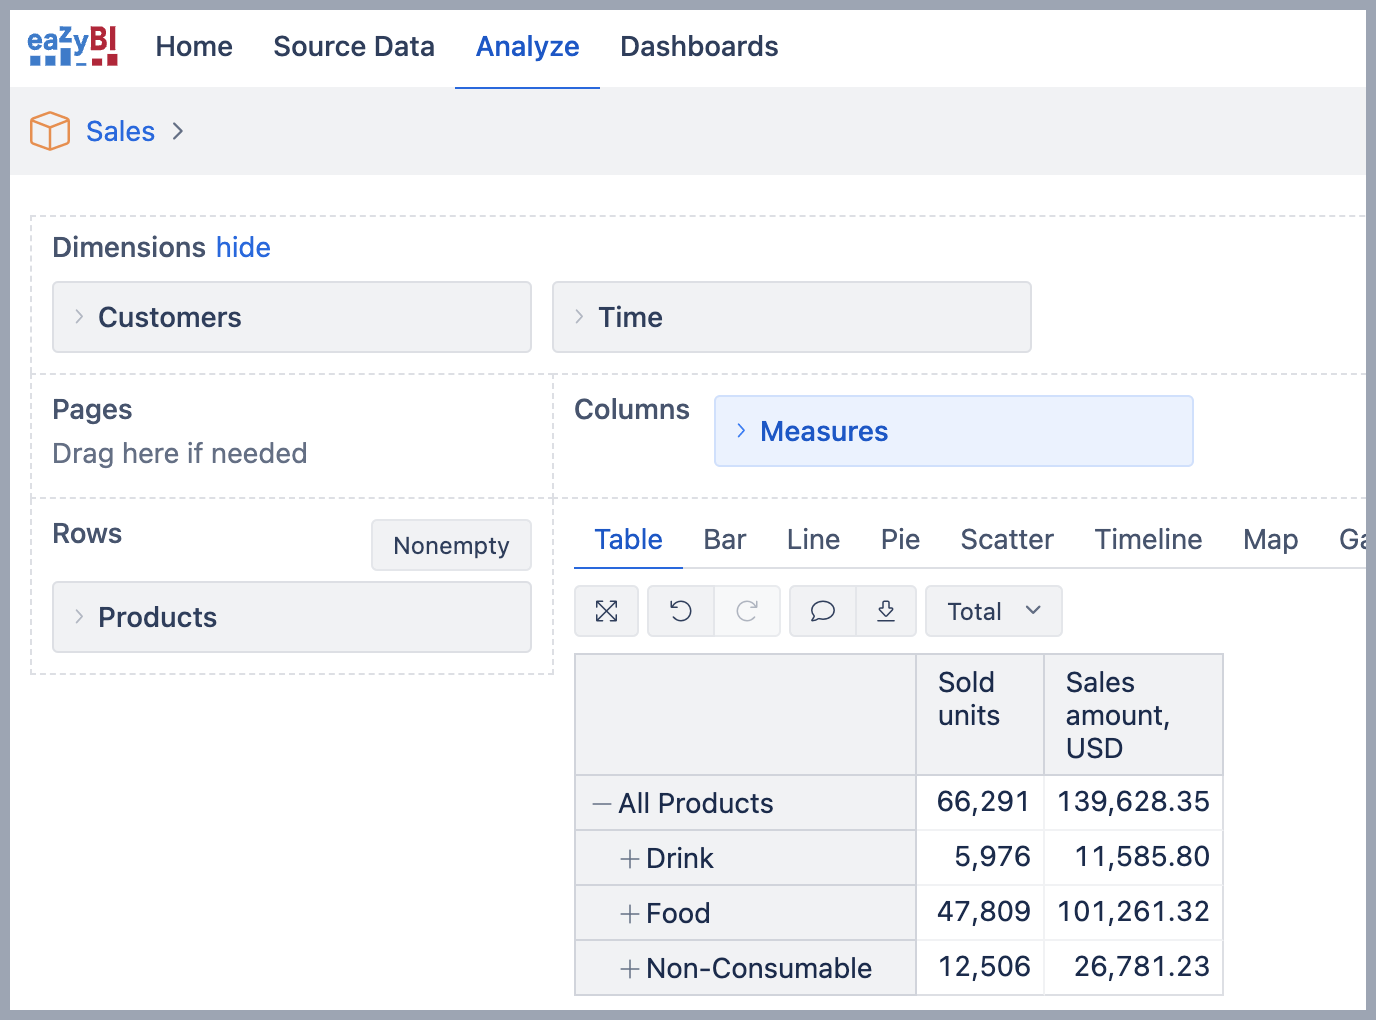
You can access the data model and imported data through the user interface; when you create a report, you can see all available dimensions (dimension tables) and measures (fact table).
For example, the Sales data model in the report builder would look like below.
In eazyBI, you can create calculated measures and dimension members, but those won't change the data model because those are calculated only when you run a report.
Data cubes vs. data model
Each eazyBI account has one or multiple data cubes and only one data model that defines relationships between data for all cubes in the account.
Single data cube
The most common use case is one data cube per account created from one or several data sources. This option works well for closely related data with shared measures. For example, if you import data from Jira, then eazyBI creates the Issue data cube during the initial data import. If needed, you can enrich imported data with additional data.
In the report, you can combine measures and dimensions from different data sources as long as they are imported into the same data cube.
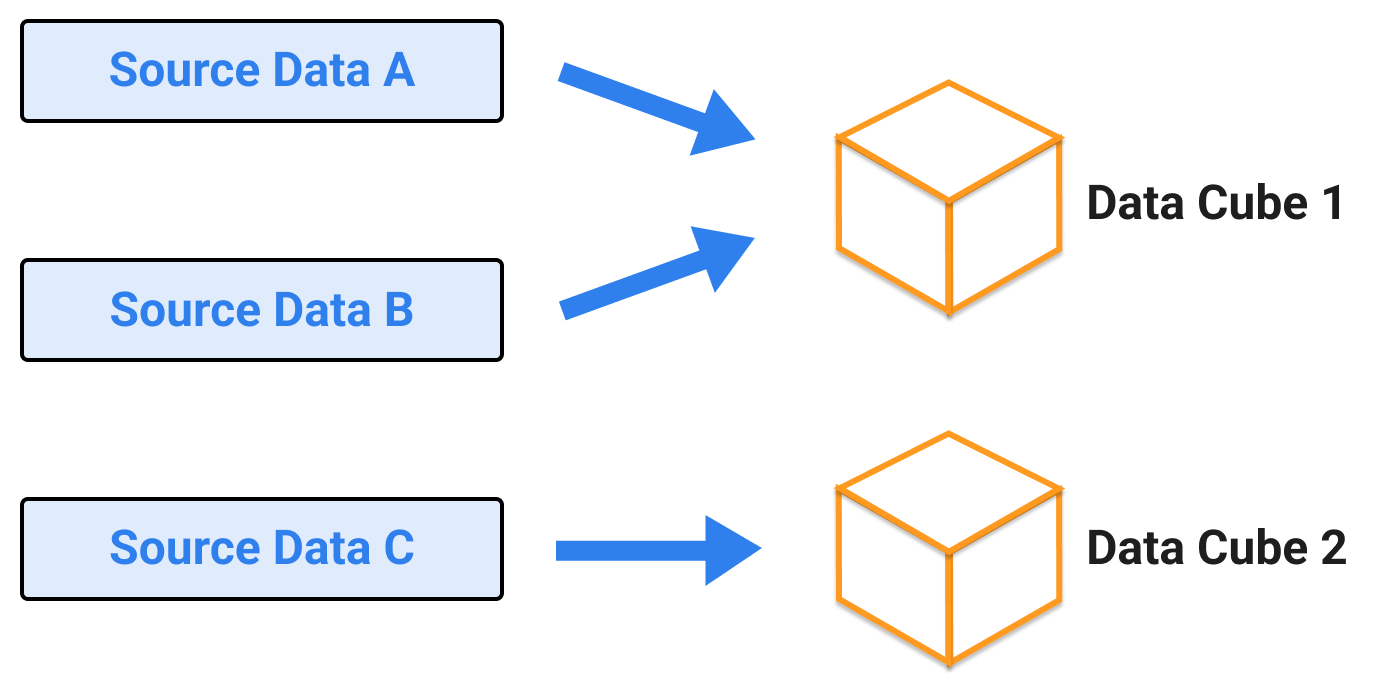
Multiple data cubes
You can create several data cubes in the same eazyBI account if data are imported from different data sources and are not closely related. Each data cube has its own fact table, and dimensions tables (separate star schema), but dimensions with the same name in several cubes are shared. For example, if you have a dimension with the name "Time" in two data cubes, the data model has only one dimension table for Time, and it is shared with both cubes and related to both fact tables.
A report can cover data from just one data cube; you can not combine data from two different data cubes in the same report.
See also
- Main concepts
- Data mapping
- Training videos on introduction to eazyBI and data import
- Training video on account management


