Calculated measures
This page describes calculated measures and how and when to create them.
There are two types of measures, predefined measures (created by the eazyBI app) and calculated measures (user-defined and report-specific measures created by you and other eazyBI users).
Describe calculation steps or specific logic using MDX (multidimensional expressions) query language. You can get creative and combine different measures, dimensions, and functions and create whatever you desire. Go nuts! The result of the calculated measure could be numerical value (count, duration, percentage, etc.), date with or without time, and plain and formatted text.
MDX understands the data structure and can identify a parent, children, and siblings for any data entity; therefore, it can travel across data in a multidimensional data cube. For example, "April 2023" is a child of a quarter "Q2 2023", a sibling of "May 2023", and has 30 children like "Apr 21 2023".
The measure is the treasure! The measure sets the report context, and you can use one or multiple measures. Fields imported as properties don't set a context.
When to use calculated measures
Calculated members and calculated measures can be used to describe additional business logic on top of the imported data. The most common use cases for calculated members and measures are to group particular items of interest, dynamically change time according to the current date or selected period, and, most importantly, derive new measurements from existing data.
The value of a measure is retrieved or calculated for each report cell. By default, the measure represents each dimension member that is on the report row, column, and page filter. And you can address each cell using the function CurrentMember. Typically you would use only a subset of available dimensions on rows, columns, and pages to build a report. However, if a dimension is not used to build a report or is selected with the All Members value, eazyBI applies the DefaultMember as CurrentMember.
In some cases, a value of a measure should be calculated relative to some other value. For example, compare the value to another member, like the previous year, or compare the value to another measure to calculate a percentage. This is the time to create a new calculated measure to get the value of another member and calculate results dynamically using the MDX expression.
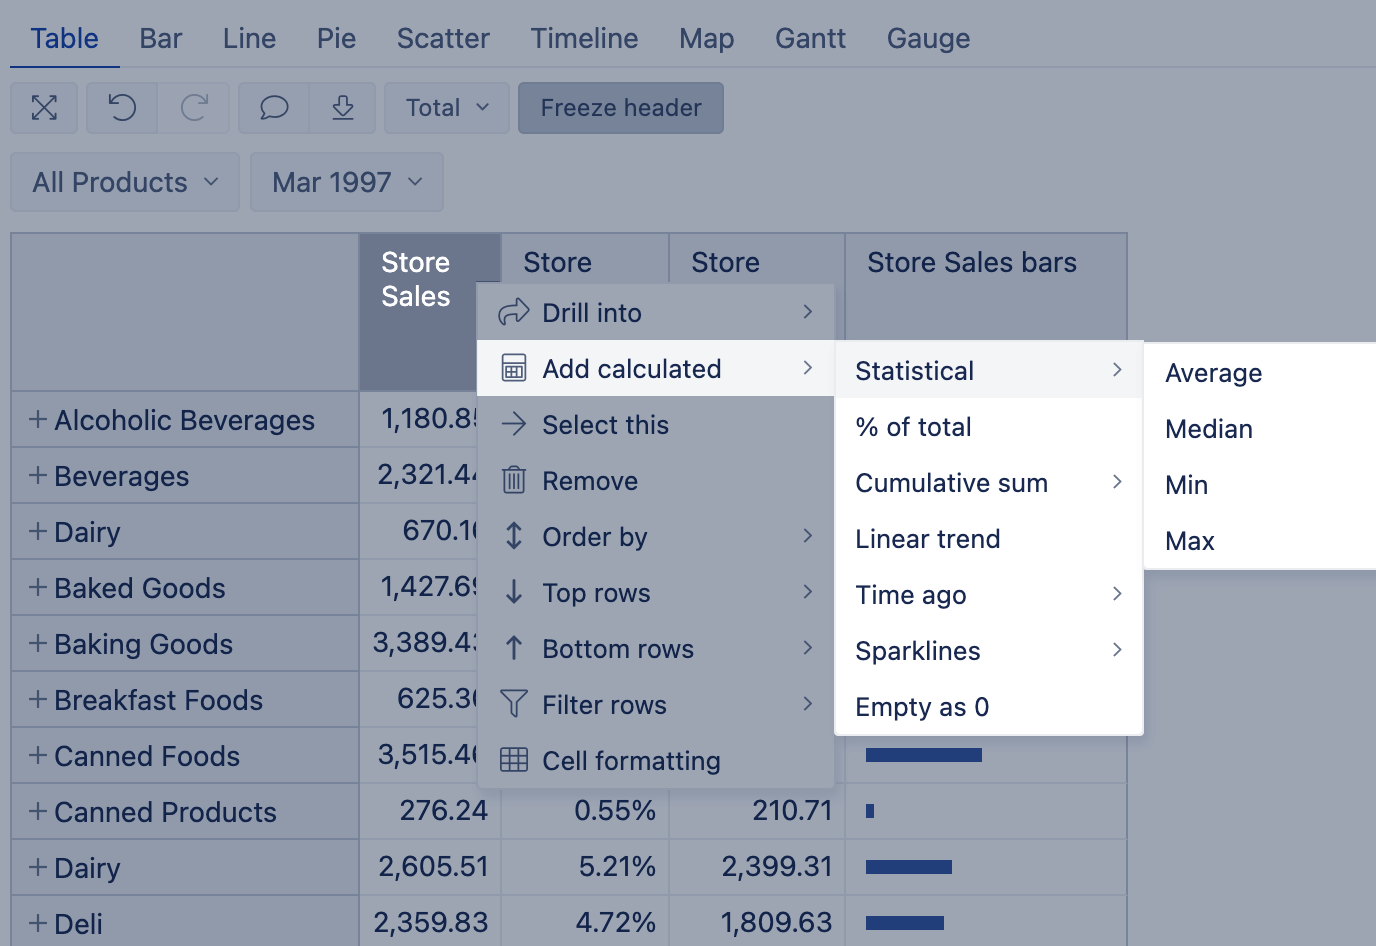
Before creating a new calculated measure, always check first if you can get results using standard calculations.
Report specific measures
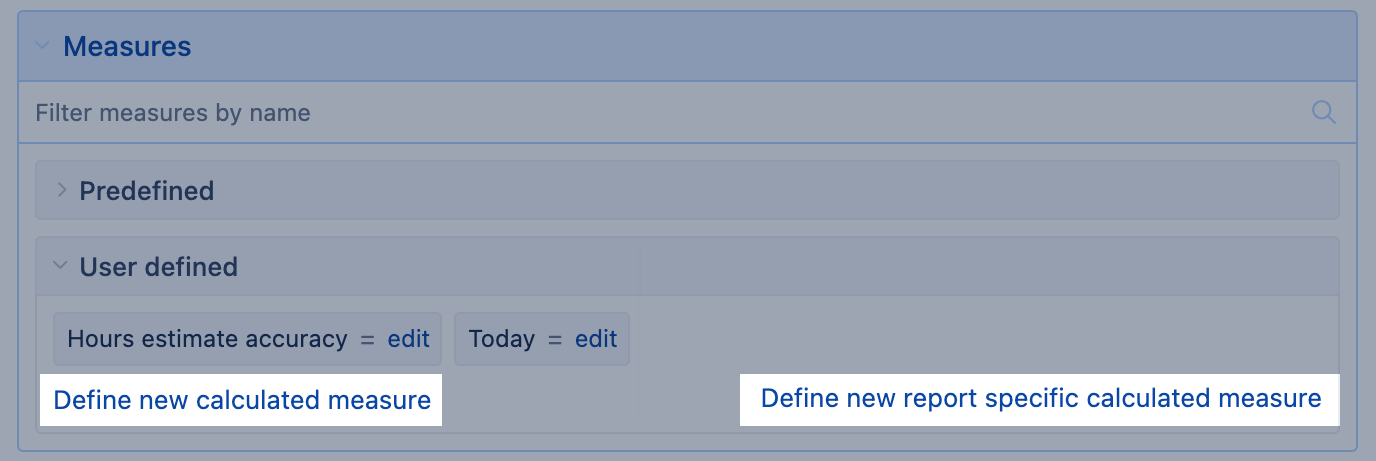
It is possible to create the user-defined measures that will not be visible in the section of all user-defined measures but are present in a specific report only. This option is useful if the measure is not intended for use in any other context than in a specific report. The report specific measures behave the same way as any other user-defined measure, the difference is in the visibility of such measures. See user roles that can create new report-specific calculated measures.
The report specific measures are located in a separate section of the Measures dimension. This section is empty once the user starts designing a new report.
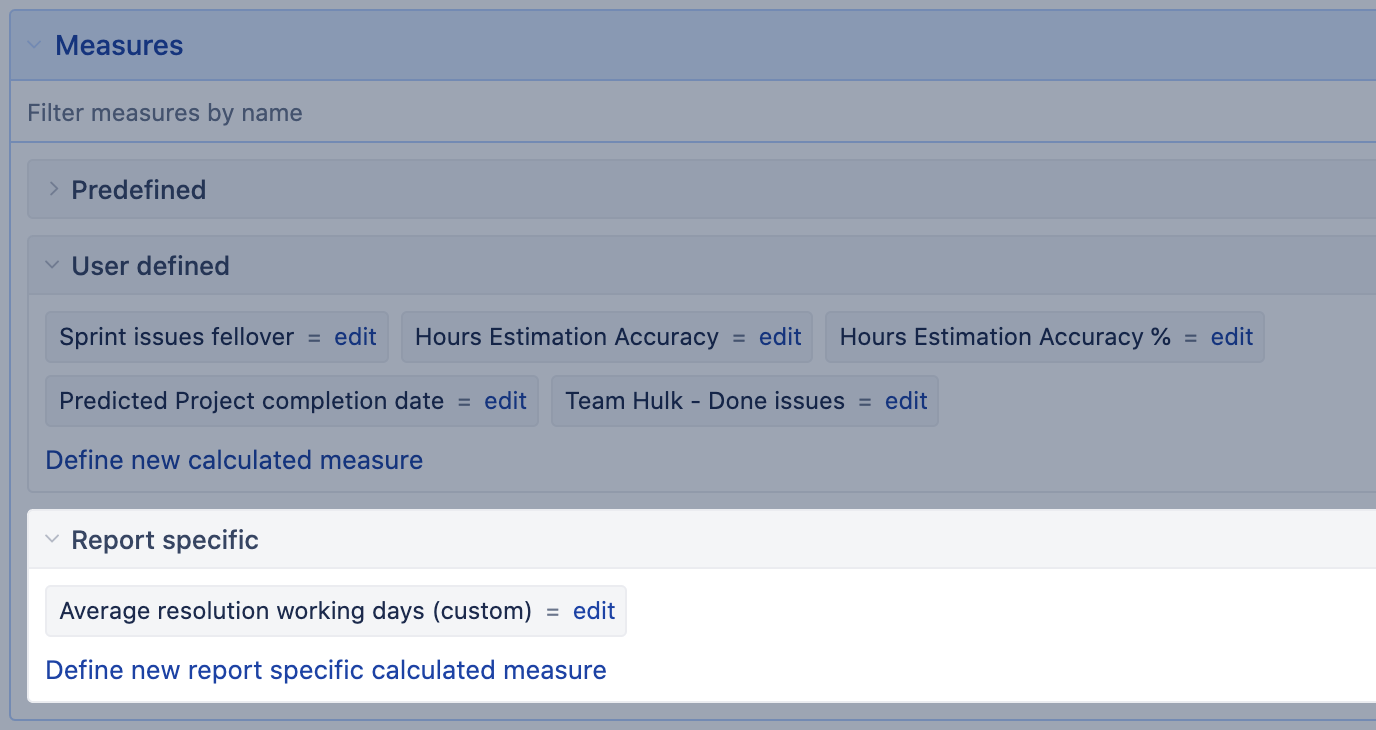
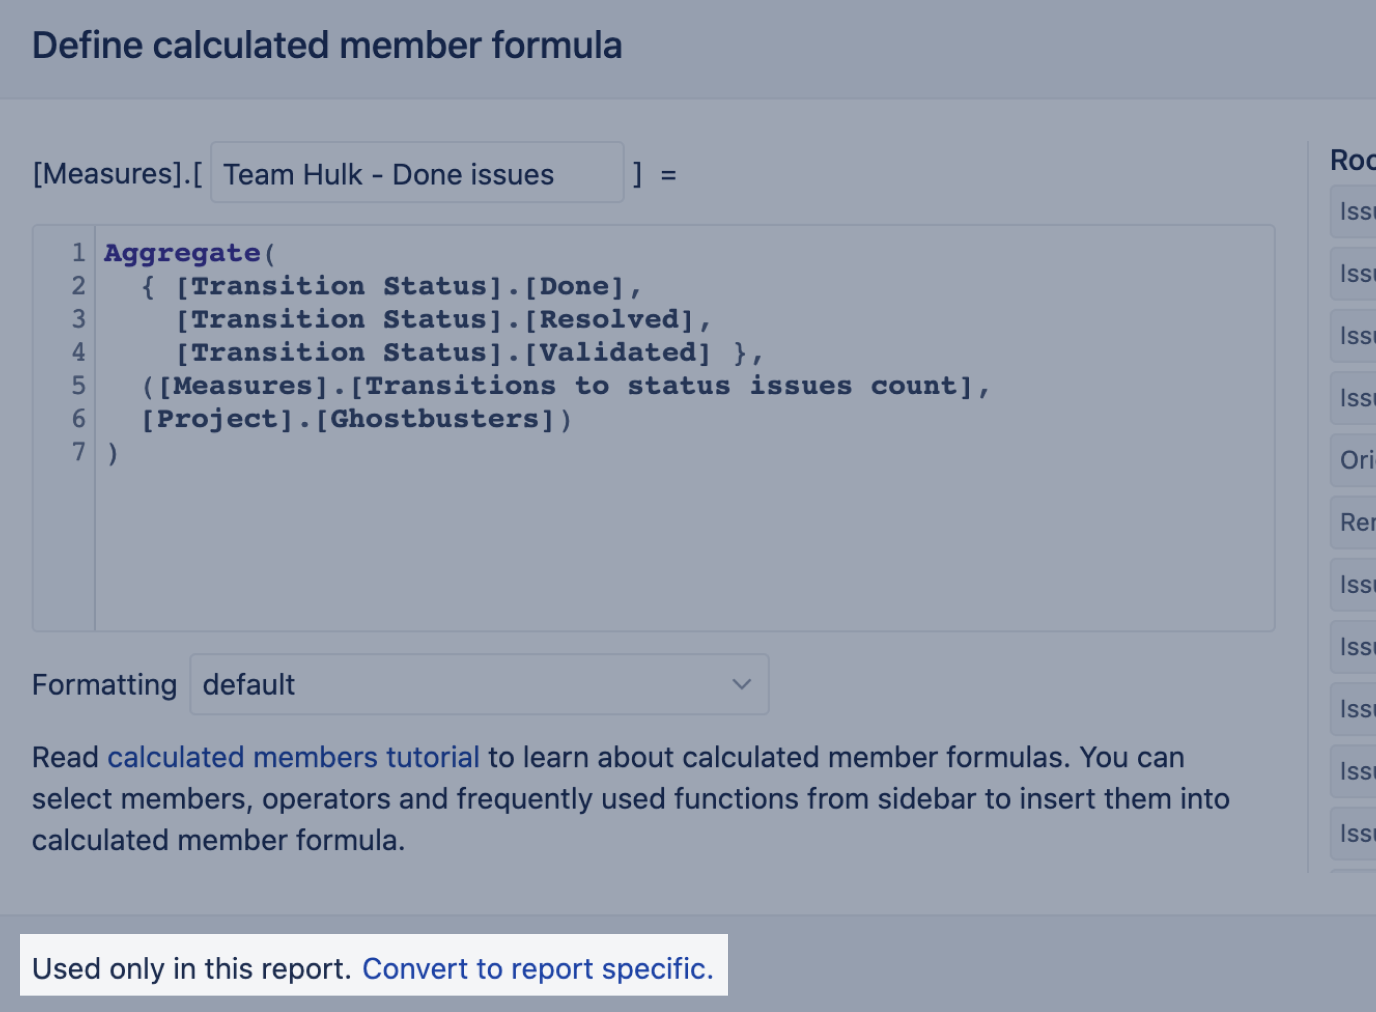
The measure edit dialogue shows the information in how many reports and how many other measures this measure is referenced. There is an option to convert a common (shared) user-defined measure to a report specific measure if the user-defined measure is not used in any report. Once you convert the measure, it is stored together with the report and not visible in the user-defined section.
Expressions in calculated measures
MDX expression is a small but highly useful snippet of code that can be used to create calculated measures, which add significant power to analysis cubes. Typically used expressions in eazyBI
- tuple expression to get a specific value from a multi-dimensional data cube
- arithmetic expression for simple mathematical calculations
- set expression with Aggregate functions
- logical expression (Conditions)
Tuple expression
A tuple is an intersection of member(s) from different dimensions and one measure. A tuple uniquely identifies a slice of data from a cube, representing a single data cell. For some people, it helps to think of a tuple as an address or coordinates to find value in the multi-dimensional data cube.
Tuple characteristics:
- Should contain no more than one measure. If no measure is specified, eazyBI will try to detect some metric independently,
- Can not include more than one member from any particular dimension.
If a dimension is not included in the tuple, eazyBI uses its CurrentHierarchyMember: the selected member if present in the report, or the DefaultMember (e.g., All) if not. No need to include unused dimensions.
In the example below, the calculation would show store sales amount of drinks in California. Other dimensions on report rows, columns, and pages (except the dimension mentioned in the expression, Customers and Products) affect results for each report cell.
(
  --each dimension mentioned once
  [Customers].[USA].[CA],
  [Products].[Drink],
  --only one measure
  [Measures].[Store Sales]
)
The second example describes the percentage of store sales in California for each product group (CurrentMember) compared to all products (DefaultMember) also in California. Other dimensions on report rows, columns, and pages (except the Customers dimension) affect results for each report cell.
(
  [Customers].[USA].[CA],
  [Products].CurrentMember,
  [Measures].[Store Sales]
)
/
(
  [Customers].[USA].[CA],
  [Products].DefaultMember,
  [Measures].[Store Sales]
)
Consider using a set expression if you need to combine several members from the same dimension in a tuple.
Arithmetic expression
You can create simple arithmetic calculations. Remember what you learned at school in Math class, and do not divide by zero.
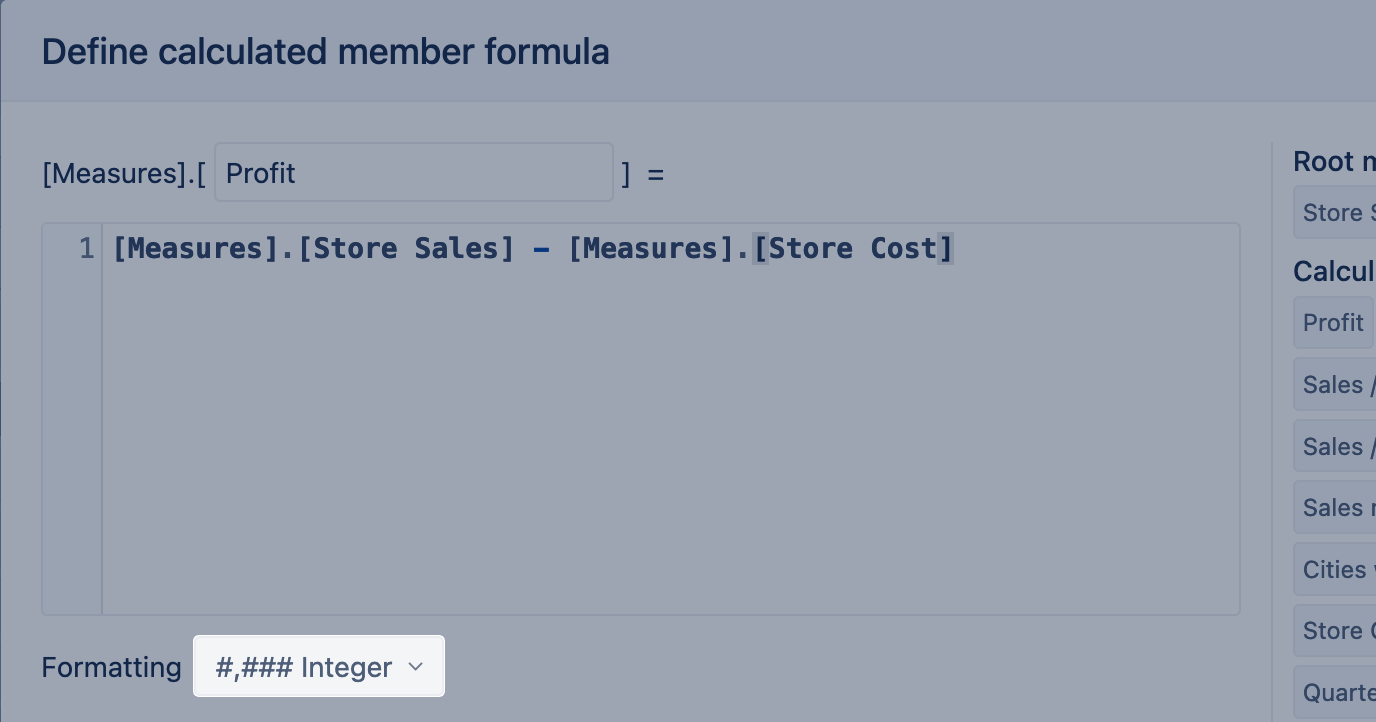
Suppose there are two measures [Measures].[Store Sales] and [Measures].[Store Cost], then you can define a new calculated measure Profit (which will have full name [Measures].[Profit]) by subtracting Store Costs from Store Sales:
[Measures].[Store Sales] -
[Measures].[Store Cost]
The new calculated measures respond to report context the same way as would the initial two measures, Store Costs from Store Sales, do. For any combination with other dimension values, this formula calculates a difference between a Store Sales measure value and a Store Cost measure value.
You can use defined calculated measures also in other calculated measures that you define later. For example, you can introduce another calculated measure [Measures].[Margin %] to show the percentage of Profit against the Store Sales.
[Measures].[Profit] /
[Measures].[Store Sales]
Suppose the Profit value is used only for one report or further calculation; then you can skip making a separate calculated measure for the profit and describe the logic in one expression. Notice that the subtraction part is enclosed in brackets, so it is performed before dividing (the same as they teach you in school). Note that percentage is calculated as a number from 0 to 1. Change calculated measure formatting to display results as a percentage value.
([Measures].[Store Sales] - [Measures].[Store Cost])
/
[Measures].[Store Sales]
Set expression
A set is a collection of members and may contain many members, one member, or be empty.
When to use a set expression:
- Group and sort dimension members to get results for a specific subset of dimension members.
- Find a specific element or multiple elements within a set of members to perform further calculations or print them in a report.
- Perform calculations on a filtered set of members; for example, counting, calculating the average value, and statistics. Some set expressions to get the Average, Median, Min, or Max value are already covered with eazyBI standard calculations. Do not reinvent the wheels; check if the solution you are looking for is already there.
The first example describes how to transform a tuple into a set. The formula below calculates the Stores Sale of California (USA) state for specified product groups – Drinks and Food. Use the curly braces { } to construct a set of specific members from the same dimension and level.
Sum(
  --set of two products
  {[Products].[Drink], [Products].[Food]},
  --tuple expression for each product in a set
  (
    [Customers].[USA].[CA],
    [Measures].[Store Sales]
  )
)
The second example describes how to find the drink's name with the most units sold in 2023 Q2.
In the code below, the function Descendants() is used to get members of the product subcategory level from the specific product family Drink. And function item() returns a specific element from a set (like in the array, the first element in a set is zero). Address the member by GetCaption to print the member display name in the report.
CASE WHEN
  --if there are any Drink unit sales in Q2
  (
    [Measures].[Unit Sales],
    [Products].[Drink],
    [Time].[2023].[Q2 2023]
  ) > 0
THEN
  -- calculate and find the most sold drink
  Order(
    --set of product subcategory members from product family "Drink"
    Descendants([Products].[Drink], [Products].[Product Subcategory]),
    --numeric expression for sorting dscending direction
    (
      [Measures].[Unit Sales],
      [Time].[2023].[Q2 2023]
    ),
    BDESC
  --return the display name of the first item from ordered set
  ).Item(0).GetCaption
END
The third example describes how to get the aggregated value of the filtered set. The formula below calculates the store sale of specific product subcategory Beer on weekends. Use the function Filter() to find a set of members by one or several criteria; in this case, filter criteria is Day level member property representing the day of the week.
Sum(
  --set of filtered week days, saturday and sundays
  Filter(
    Descendants([Time].CurrentHierarchyMember, [Time].CurrentHierarchy.Levels('Day')),
    [Time].CurrentHierarchyMember.Get('Week day') >= 6
  ),
  --numeric expression, store sales on specific product Beer
  (
    [Measures].[Store Sales],
    [Products].[Drink].[Alcoholic Beverages].[Beer and Wine].[Beer]
  )
)
The function SetToStr() can help you validate what is in the set while you build the calculation.
For more details on how to construct calculated measures with sets, check the training video below:
Slides: 23-handling-sets.pdf
Logical expression
You can write formulas with logical conditions:
- for simple IF / THEN / ELSE type of conditions, use Iif(). Notice that the function name has two letters "I".
- for many conditions, then it is easier to use a CASE statement.
You can use operators to validate if the conditions are met:
- standard comparison operators:
=, <, <=, <>, >, >=; - logical operators
AND,OR; - operator
MATCHEScompares a string with another string or regular expression; - special operator
ISreturns whether two members are the same. This is commonly used to check if a current member is also the default member; - special operator
INwhether a member is in a set; it is shorthand for multipleORconditions; - boolean operator
NOTusually used together with listed operators and other logical functions.
The first example shows a boolean expression with Iif() function. Expression compares store sales results of specific product subcategories – Wine and Beer. If wine is sold more, then show the wine icon in dark red color, else show the beer icon in green color. Set the Markdown formatting to show results as icons.
IIf(
  --condition, compare wine store sales with beer store sales
  (
    [Measures].[Store Sales],
    [Products].[Drink].[Alcoholic Beverages].[Beer and Wine].[Wine]
  )
  >
  (
    [Measures].[Store Sales],
    [Products].[Drink].[Alcoholic Beverages].[Beer and Wine].[Beer]
  ),
  --result for true, show wine icon in dark red color
  "<i class='fa-solid fa-wine-glass' style='color:darkred'></i>",
  --result for false, show beer mug icon in green color
  "<i class='fa-solid fa-beer-mug' style='color:green'></i>"
)
The second example is a CASE statement describing more than one condition. The expression below checks on the Margin % range and prints the asserted margin group.
CASE
  WHEN --margin between 0% and 50%
    [Measures].[Margin %] > 0 AND
    [Measures].[Margin %] < 0.5
  THEN 'Small margin'
  WHEN --margin between 50% and 60%
    [Measures].[Margin %] >= 0.5 AND
    [Measures].[Margin %] < 0.6
  THEN 'Significant margin'
  WHEN --margin more than 60%
    [Measures].[Margin %] >= 0.6
  THEN 'Big margin'
  ELSE 'No margin'
END
Formatting
When creating a new calculated measure, you can choose the format for the output of results. By default, eazyBI tries to guess the right output format for calculated measure, but in some cases, is not correctly identified or not the desired result. Then choose formatting manually.
You can choose between the following formats:
Numeric |
|
|---|---|
Percentage |
|
Date / Time |
|
Duration |
|
Size |
|
Text |
eazyBI uses Font Awesome icons, and it is possible to reference them in a calculated measure using markdown formatting. See some examples here: https://community.eazybi.com/t/measure-formatting-markdown-and-custom/5157 |
Sparkline |
|
Custom | With this, you can change the result representation to another, e.g., To format a numeric value as a decimal with four digits after the decimal point, you can use the You can also format numbers with numeric symbols (k or M). If you specify one or more commas immediately to the left of the decimal point, the number to be formatted is divided by 1000 for each comma. E.g. For more details (and string templates) see how to Format string content. |
See Also
- MDX functions library
- Add standard calculations
- Videos: calculations with MDX
- Calculated members in other dimensions
- Calculated members in Time dimension
- Comments in calculated measures
- Special comments with annotation to change behavior